

Global Trade in Numbers
In 2024, the United States remains one of the world’s biggest importers, drawing in goods from nearly every corner of the globe. Whether it’s electronics, vehicles, machinery, or textiles, the flow of goods into the U.S. reflects deep international trade ties—and some surprising shifts in global economics.
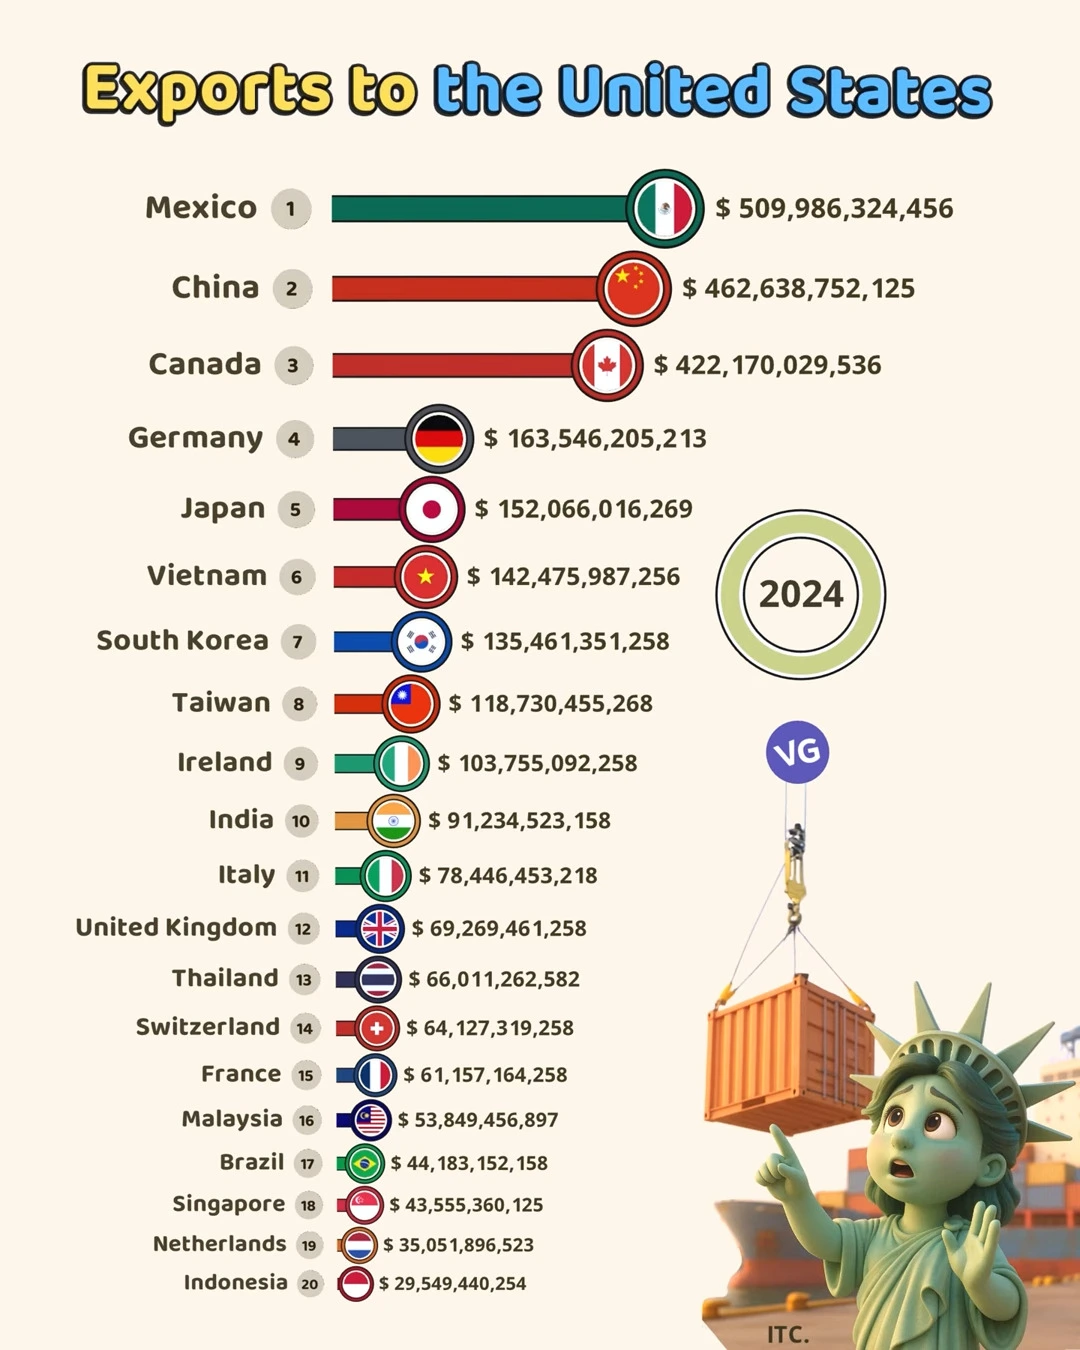
Based on data from the International Trade Centre (ITC), here’s a closer look at the top 20 countries exporting to the U.S. this year.
📦🇺🇸 Exports to the United States – 2024 📊
| Country | Flag | Export Value (USD) 💵 |
|---|---|---|
| Mexico | 🇲🇽 | $509,986,324,456 |
| China | 🇨🇳 | $462,638,752,125 |
| Canada | 🇨🇦 | $422,170,029,536 |
| Germany | 🇩🇪 | $163,546,205,213 |
| Japan | 🇯🇵 | $152,066,016,269 |
| Vietnam | 🇻🇳 | $142,475,987,256 |
| South Korea | 🇰🇷 | $135,461,351,258 |
| Taiwan | 🇹🇼 | $118,730,455,268 |
| Ireland | 🇮🇪 | $103,755,092,258 |
| India | 🇮🇳 | $91,234,523,158 |
| Italy | 🇮🇹 | $78,446,453,218 |
| United Kingdom | 🇬🇧 | $69,269,461,258 |
| Thailand | 🇹🇭 | $66,011,262,582 |
| Switzerland | 🇨🇭 | $64,127,319,258 |
| France | 🇫🇷 | $61,157,164,258 |
| Malaysia | 🇲🇾 | $53,849,456,897 |
| Brazil | 🇧🇷 | $44,183,152,158 |
| Singapore | 🇸🇬 | $43,555,360,125 |
| Netherlands | 🇳🇱 | $35,051,896,523 |
| Indonesia | 🇮🇩 | $29,549,440,254 |
🌐 Top 3 Export Powerhouses

1. Mexico – $509.99 Billion
Mexico has taken the top spot in 2024, exporting over $509 billion worth of goods to the United States. Proximity, trade agreements (like USMCA), and strong manufacturing sectors in auto parts, electronics, and agriculture have contributed to this surge.
2. China – $462.64 Billion
Despite ongoing trade tensions and diversification strategies, China remains a major supplier of electronics, machinery, and consumer goods to the U.S. However, its second-place position signals a continued shift in global supply chains.
3. Canada – $422.17 Billion
As a trusted neighbor and economic partner, Canada maintains a solid third place. Key exports include oil, lumber, machinery, and vehicles, supported by longstanding trade ties and border integration.
🇩🇪 Leading European Exporters
- Germany leads Europe with exports of $163.55 billion, mostly in vehicles, industrial machinery, and pharmaceuticals.
- Ireland surprises with $103.76 billion, largely due to pharmaceutical and tech company operations.
- Italy, the UK, France, and Switzerland also appear in the top 20, exporting everything from fashion to luxury goods and precision instruments.
Rising Asian Exporters
- Japan ($152.07B) and South Korea ($135.46B) are major players, thanks to automobiles and electronics.
- Vietnam ($142.48B) and Taiwan ($118.73B) reflect shifting manufacturing trends, especially in textiles, semiconductors, and tech components.
- India ($91.23B) continues to grow its export base with pharmaceuticals, textiles, and IT hardware.
🌎 Other Noteworthy Countries
- Brazil, Malaysia, Thailand, and Singapore show up with strong regional presences.
- Netherlands and Indonesia round out the top 20, highlighting Europe and Southeast Asia’s contribution to U.S. imports.
Key Trends Behind the Numbers
- Diversified Supply Chains: With businesses seeking to reduce overreliance on a single country, exports from nations like Vietnam, India, and Mexico are rising.
- Technology & Pharma: Countries with strong tech manufacturing and pharmaceutical sectors (e.g., Taiwan, Ireland) continue to thrive.
- Regional Trade Agreements: USMCA and long-standing agreements with Canada, Mexico, and others keep regional flows strong.
Final Thoughts
These numbers are more than just trade data—they’re a reflection of economic interdependence, geopolitical shifts, and evolving industrial strengths. The United States, as a top global consumer market, continues to shape the economic destinies of its trading partners. Watching how these trends evolve will be key to understanding global economics in the years ahead.