In today’s interconnected global marketplace, understanding the relative economic strength of different nations provides crucial context for businesses, investors, and policymakers alike. Recent data from the World Bank and International Monetary Fund (IMF) reveals the distribution of global economic power in 2024, with some fascinating insights into which countries dominate the world economy.
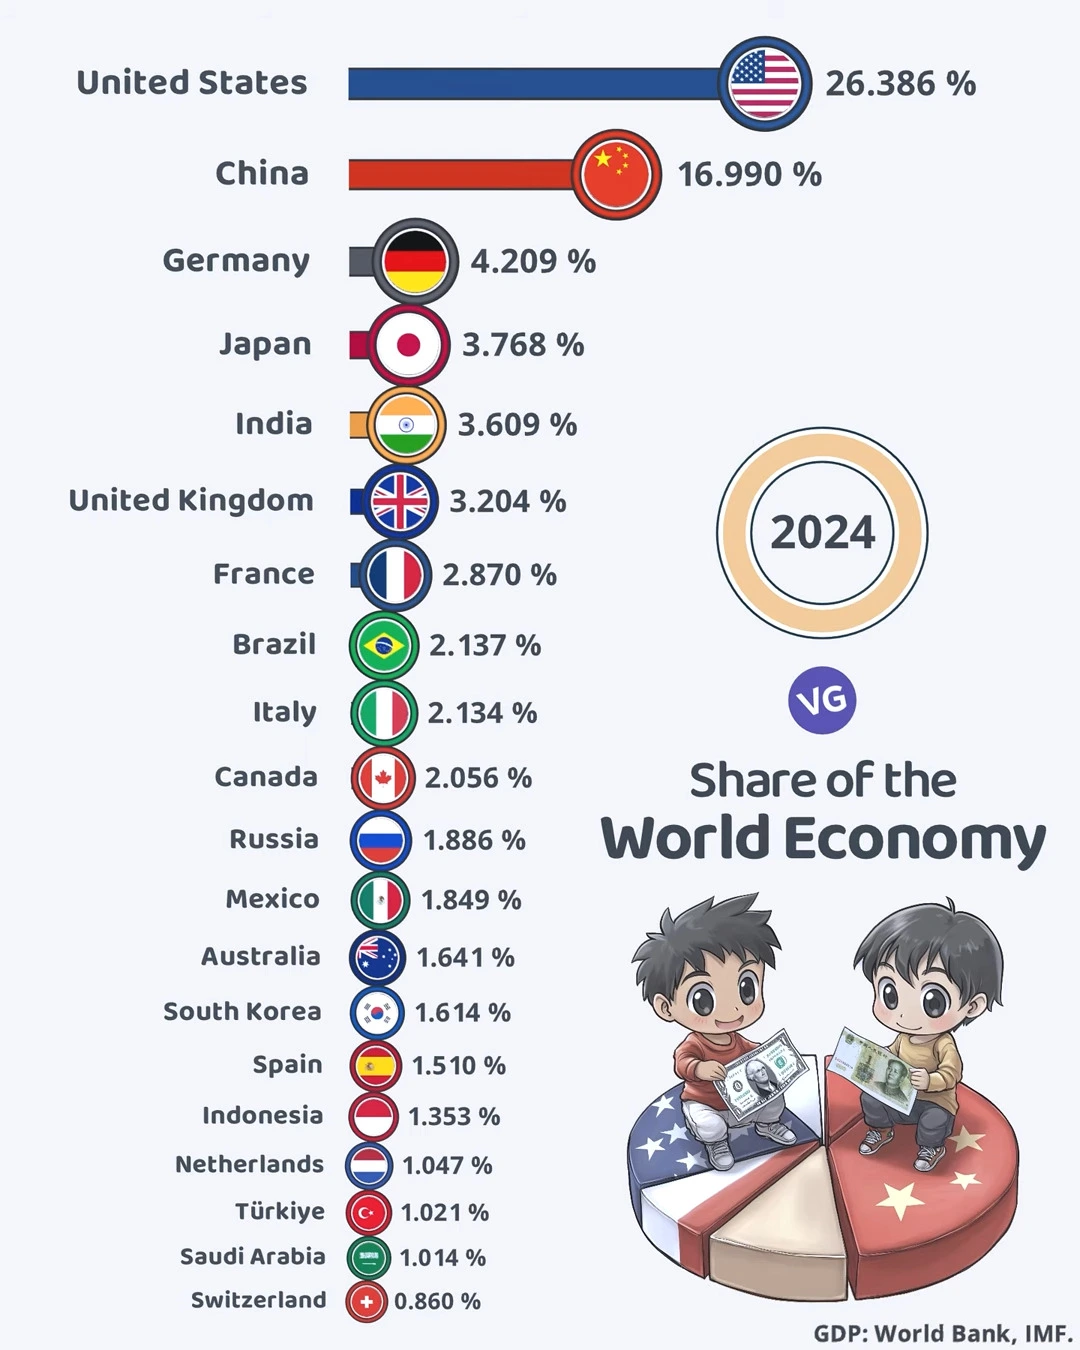
💰 Top 20 Largest Economies by Share of Global GDP (2024) 💰🌍
| Rank | Country | Share of Global GDP (%) |
|---|---|---|
| 1 🇺🇸 | United States | 26.386% |
| 2 🇨🇳 | China | 16.990% |
| 3 🇩🇪 | Germany | 4.209% |
| 4 🇯🇵 | Japan | 3.768% |
| 5 🇮🇳 | India | 3.609% |
| 6 🇬🇧 | United Kingdom | 3.204% |
| 7 🇫🇷 | France | 2.870% |
| 8 🇧🇷 | Brazil | 2.137% |
| 9 🇮🇹 | Italy | 2.134% |
| 10 🇨🇦 | Canada | 2.056% |
| 11 🇷🇺 | Russia | 1.886% |
| 12 🇲🇽 | Mexico | 1.849% |
| 13 🇦🇺 | Australia | 1.641% |
| 14 🇰🇷 | South Korea | 1.614% |
| 15 🇪🇸 | Spain | 1.510% |
| 16 🇮🇩 | Indonesia | 1.353% |
| 17 🇳🇱 | Netherlands | 1.047% |
| 18 🇹🇷 | Türkiye | 1.021% |
| 19 🇸🇦 | Saudi Arabia | 1.014% |
| 20 🇨🇭 | Switzerland | 0.860% |
The Economic Superpowers: US and China
The United States continues to maintain its position as the world’s largest economy, commanding an impressive 26.386% of global GDP. This dominance reflects America’s robust service sector, technological innovation, and substantial consumer market.
China holds the second position with 16.990% of the world economy. The gap between the US and China remains significant—nearly 10 percentage points—but China’s consistent growth over recent decades has solidified its status as an economic superpower. Together, these two nations account for over 43% of the global economy, highlighting their outsized influence on international markets and trade relations.
European Economic Powerhouses
European nations maintain substantial economic clout despite individual countries having smaller shares than the US or China. Germany leads Europe with 4.209% of the global economy, followed by the United Kingdom (3.204%), France (2.870%), and Italy (2.134%). Collectively, these four European powers represent over 12% of world GDP, demonstrating Europe’s continued relevance in the global economy despite challenges facing the region.
Asian Tigers and Rising Powers
Japan remains a significant economic force with 3.768% of global GDP, closely followed by India at 3.609%. India’s position reflects its growing importance as one of the world’s fastest-developing large economies.
South Korea (1.614%) and Indonesia (1.353%) represent the strength of East and Southeast Asian economies beyond the giants of China and Japan. Together with India, these nations highlight Asia’s increasing economic gravity.
The One-Percenters: Substantial Middle Powers
Several nations hover around the 1-2% mark, including Brazil (2.137%), Canada (2.056%), Russia (1.886%), Mexico (1.849%), and Australia (1.641%). These middle powers maintain significant regional influence and contribute substantially to global trade and production networks.
Saudi Arabia (1.014%), Turkey (1.021%), and the Netherlands (1.047%) just manage to cross the one-percent threshold, while Switzerland (0.860%) falls just below it despite its outsized role in global finance.
Economic Implications and Future Outlook
This distribution of economic power has profound implications for global governance, trade negotiations, and geopolitical influence. The concentration of economic might in a relatively small number of countries—the top five economies alone represent over 54% of global GDP—continues to shape international institutions and decision-making processes.
As we progress further into 2024, these percentages may shift due to varying growth rates, inflationary pressures, and structural changes in different economies. Emerging markets, particularly in Asia and Africa (though not represented among the top 20 shown), may gradually increase their share of the global economy in the coming decades.
Source: Data from World Bank and IMF as indicated in the image, 2024