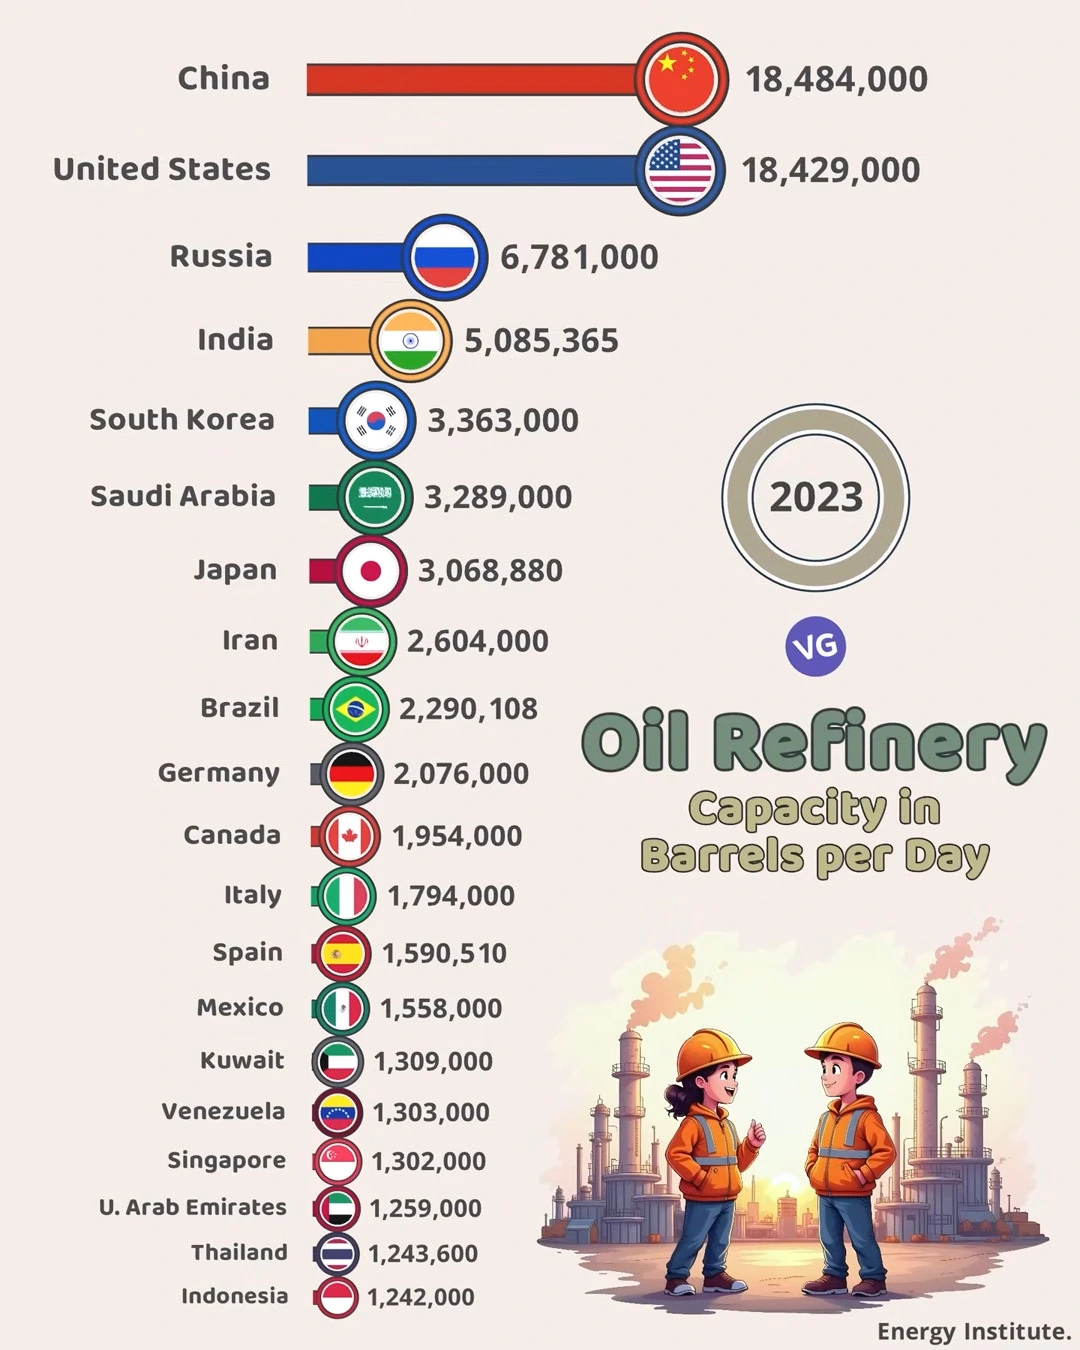
The 2023 data from the Energy Institute provides a comprehensive view of global oil refining capacity, measured in barrels per day (BPD). This data reveals important patterns in energy infrastructure and industrial capacity across major economies.
| Rank | Country | Refining Capacity (Barrels/Day) |
|---|---|---|
| 1 | 🇨🇳 China | 18,484,000 |
| 2 | 🇺🇸 United States | 18,429,000 |
| 3 | 🇷🇺 Russia | 6,781,000 |
| 4 | 🇮🇳 India | 5,085,365 |
| 5 | 🇰🇷 South Korea | 3,363,000 |
| 6 | 🇸🇦 Saudi Arabia | 3,289,000 |
| 7 | 🇯🇵 Japan | 3,068,880 |
| 8 | 🇮🇷 Iran | 2,604,000 |
| 9 | 🇧🇷 Brazil | 2,290,108 |
| 10 | 🇩🇪 Germany | 2,076,000 |
| 11 | 🇨🇦 Canada | 1,954,000 |
| 12 | 🇮🇹 Italy | 1,794,000 |
| 13 | 🇪🇸 Spain | 1,590,510 |
| 14 | 🇲🇽 Mexico | 1,558,000 |
| 15 | 🇰🇼 Kuwait | 1,309,000 |
| 16 | 🇻🇪 Venezuela | 1,303,000 |
| 17 | 🇸🇬 Singapore | 1,302,000 |
| 18 | 🇦🇪 UAE | 1,259,000 |
| 19 | 🇹🇭 Thailand | 1,243,600 |
| 20 | 🇮🇩 Indonesia | 1,242,000 |
Leading Nations
Top Tier Refiners
China and the United States dominate global refining capacity with remarkably close figures:
- China: 18,484,000 BPD
- United States: 18,429,000 BPD
These nearly identical capacities show the industrial parity between these economic superpowers in petroleum processing.
Second Tier
Russia stands as a distant third with 6,781,000 BPD, followed by India with 5,085,365 BPD, demonstrating the significant gap between the top two and the rest of the world.
Regional Analysis
East Asian Capacity
The East Asian region shows significant refining presence:
- South Korea: 3,363,000 BPD
- Japan: 3,068,880 BPD
These figures reflect the region’s industrial strength and energy demands.
Middle Eastern Hub
Several Middle Eastern nations maintain substantial capacity:
- Saudi Arabia: 3,289,000 BPD
- Iran: 2,604,000 BPD
- Kuwait: 1,309,000 BPD
- UAE: 1,259,000 BPD
European Presence
European Industrial Powers
Major European economies maintain significant capacity:
- Germany: 2,076,000 BPD
- Italy: 1,794,000 BPD
- Spain: 1,590,510 BPD
Key Insights
Geographic Distribution
The data shows:
- Strong Asian presence in refining capacity
- Significant Middle Eastern capabilities
- Balanced distribution across developed economies
- Strategic positioning near major shipping routes
Industrial Implications
The refinery capacity distribution reflects:
- Energy security priorities
- Industrial development levels
- Strategic energy infrastructure
- Regional energy trade patterns
This data provides crucial insights into global energy processing capabilities and industrial development patterns across major economies in 2023.