In today’s interconnected global economy, understanding the distribution of economic power across regions provides crucial insights for businesses, investors, and policymakers alike. Recent data from the World Bank and IMF reveals a fascinating picture of Europe’s economic landscape in 2025, with clear hierarchies emerging among the continent’s diverse nations.
Data Source: World Bank, IMF
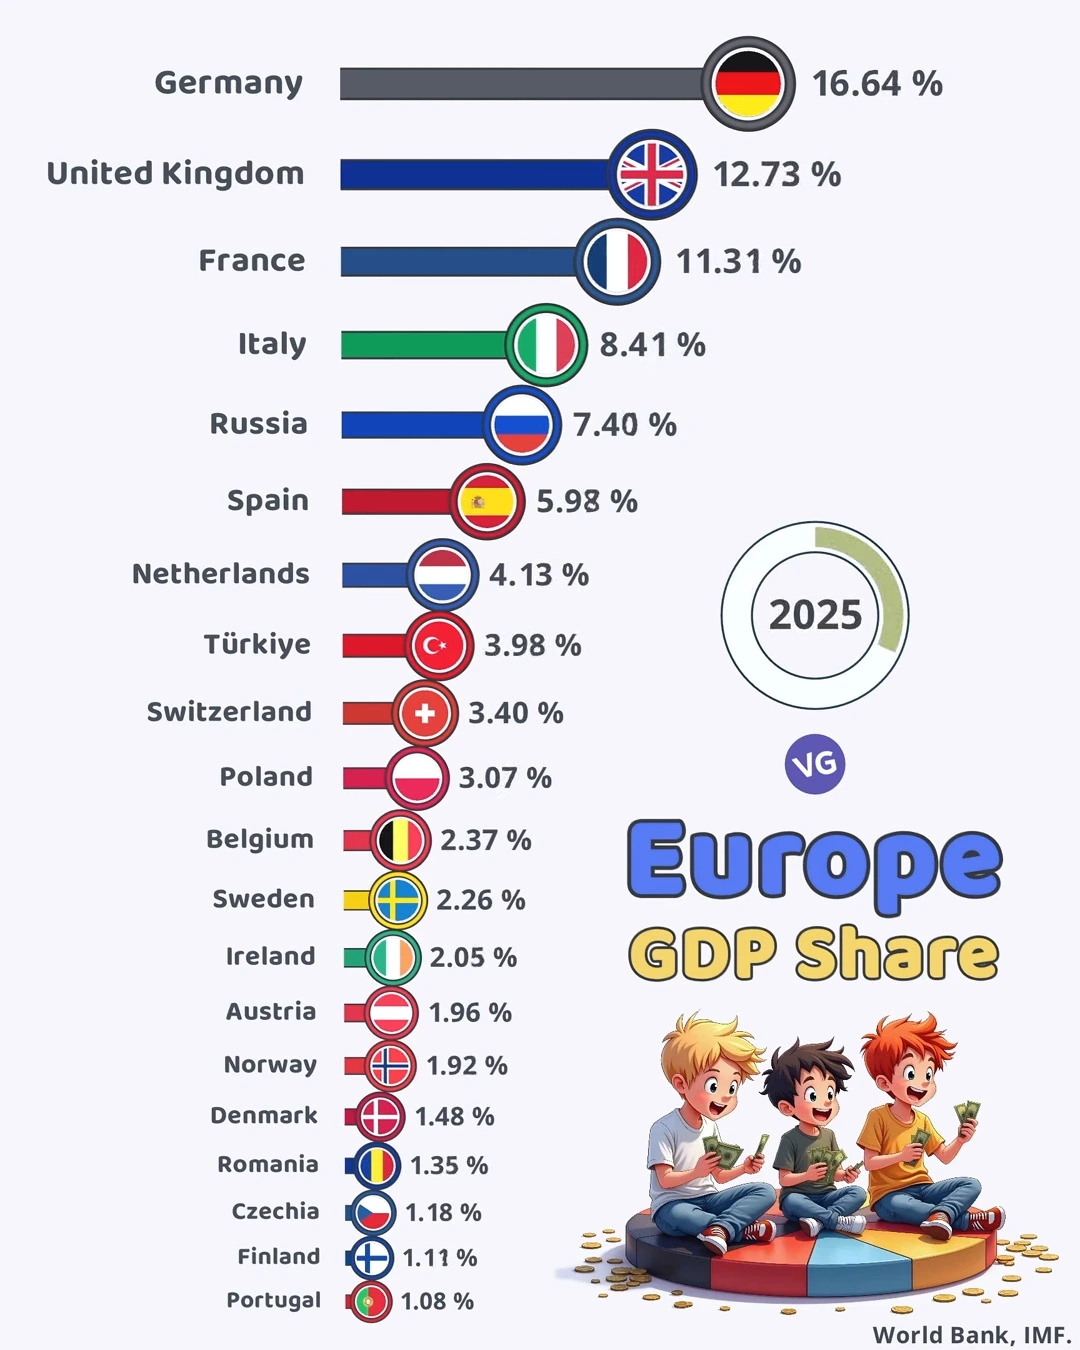
🇪🇺 Europe’s Largest Economies by GDP Share (2025)
| Rank | Country | GDP Share (%) |
|---|---|---|
| 1️⃣ | 🇩🇪 Germany | 16.64% |
| 2️⃣ | 🇬🇧 United Kingdom | 12.73% |
| 3️⃣ | 🇫🇷 France | 11.31% |
| 4️⃣ | 🇮🇹 Italy | 8.41% |
| 5️⃣ | 🇷🇺 Russia | 7.40% |
| 6️⃣ | 🇪🇸 Spain | 5.98% |
| 7️⃣ | 🇳🇱 Netherlands | 4.13% |
| 8️⃣ | 🇹🇷 Türkiye | 3.98% |
| 9️⃣ | 🇨🇭 Switzerland | 3.40% |
| 🔟 | 🇵🇱 Poland | 3.07% |
| 11 | 🇧🇪 Belgium | 2.37% |
| 12 | 🇸🇪 Sweden | 2.26% |
| 13 | 🇮🇪 Ireland | 2.05% |
| 14 | 🇦🇹 Austria | 1.96% |
| 15 | 🇳🇴 Norway | 1.92% |
| 16 | 🇩🇰 Denmark | 1.48% |
| 17 | 🇷🇴 Romania | 1.35% |
| 18 | 🇨🇿 Czechia | 1.18% |
| 19 | 🇫🇮 Finland | 1.11% |
| 20 | 🇵🇹 Portugal | 1.08% |
Germany Leads the Pack
Germany maintains its position as Europe’s economic powerhouse, contributing a substantial 16.64% to the continent’s total GDP. This dominance reflects Germany’s robust manufacturing sector, technological innovation, and export-oriented economy that has weathered recent global economic challenges with remarkable resilience.
The Big Three: Economic Titans
Following Germany, the United Kingdom (12.73%) and France (11.31%) round out Europe’s “Big Three” economies, collectively accounting for over 40% of the continent’s economic output. Despite Brexit’s predicted negative impacts, the UK has maintained strong economic performance, particularly in financial services and technology sectors. France’s position showcases its diverse economy spanning luxury goods, agriculture, and aerospace.
The Middle Tier: Regional Powers
Italy (8.41%) and Russia (7.40%) form a distinct second tier, with Italy’s economic might stemming from its industrial north and Russia leveraging its vast natural resources despite ongoing geopolitical tensions and sanctions.
Spain (5.98%) and the Netherlands (4.13%) follow as significant regional economic powers, with Spain’s tourism and agricultural sectors complementing the Netherlands’ logistics supremacy and technological innovation hubs.
The Nordic-Swiss Axis: Punching Above Their Weight
An interesting pattern emerges when examining smaller yet economically significant nations. Switzerland (3.40%), Sweden (2.26%), Norway (1.92%), Denmark (1.48%), and Finland (1.11%) collectively contribute nearly 10% to Europe’s GDP despite their relatively small populations. This demonstrates the effectiveness of their high-value economic models focusing on innovation, specialized manufacturing, and strong social infrastructure.
Eastern European Potential
Eastern European nations like Poland (3.07%), Romania (1.35%), and Czechia (1.18%) represent developing economic forces with growing manufacturing bases, increasingly skilled workforces, and strategic positions between Western Europe and Asian markets.
The Implications
This GDP distribution has several significant implications:
- Investment opportunities remain heavily concentrated in Western Europe, with nearly 80% of continental economic activity.
- The enduring economic strength of non-EU members like the UK, Switzerland, and Norway demonstrates that multiple paths to prosperity exist within the European ecosystem.
- The relative economic weight of nations significantly influences European policy decisions, with Germany, France, and the UK wielding substantial influence.
As we navigate through 2025’s economic landscape, this data serves as a crucial roadmap for understanding Europe’s complex economic hierarchy. For businesses looking to expand, investors seeking opportunities, or policymakers crafting strategies, recognizing these patterns is the first step toward making informed decisions in one of the world’s most economically significant regions.