Europe faced a huge inflation crisis in October 2022. The annual inflation rate hit a record high at 9.2%1. This surge deeply affected people and businesses across the continent. It’s important to grasp the effects of inflation and its wide-reaching impacts.
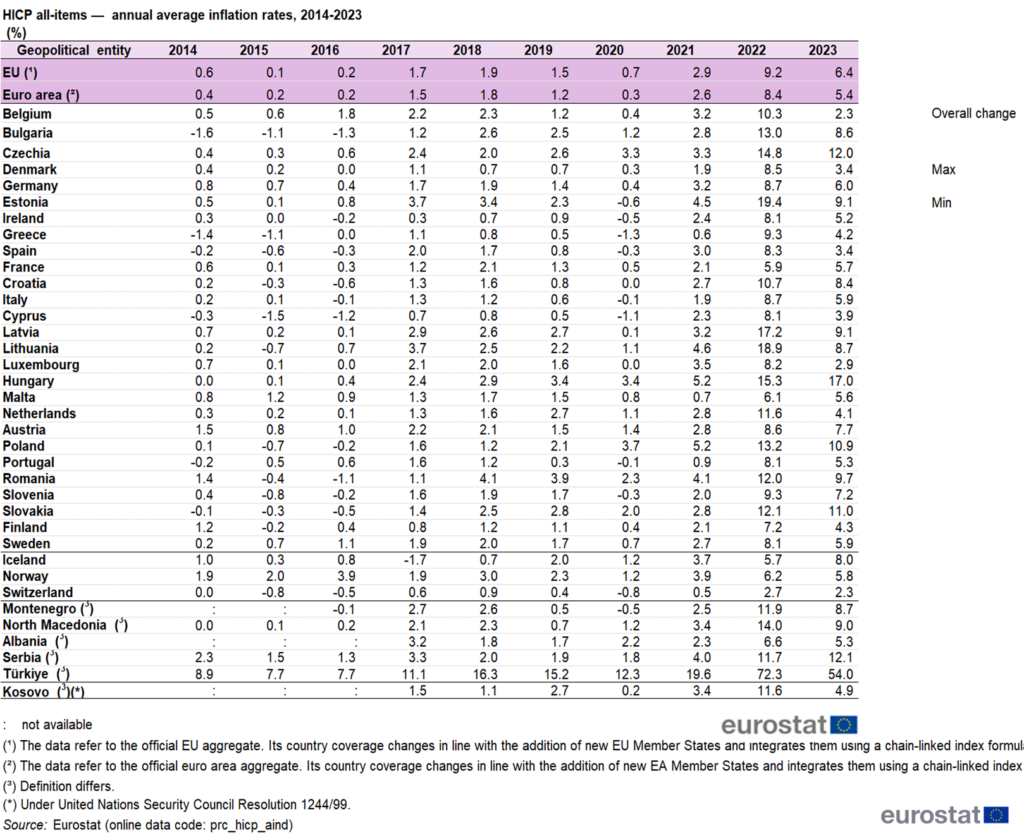
During the past ten years, the EU saw varied inflation rates. The rates fell to as low as 0.1% in 2015 and 0.2% in 20161. They then increased to 1.7% in 2017 and 1.9% in 2018 but dropped to 1.5% in 20191. The COVID-19 crisis reduced inflation to 0.7% in 2020, but it jumped to 2.9% in 2021. Finally, it peaked at 9.2% in 2022 and went down slightly to 6.4% in 20231.
From 2014 to 2023, the overall change in consumer prices in the EU was 25.2%. This averages to 2.1% each year1. Comparatively, Japan had smaller price changes, while the US and China saw higher inflation rates. Japan’s consumer prices went up by 0.9% each year, the US by 2.8%, and China by 1.7% between 2014 and 20231.
Key Takeaways
- In the last ten years, the EU faced fluctuating inflation rates, reaching a high of 9.2% in October 2022.
- The HICP in the EU rose by 25.2% from 2014 to 2023, averaging 2.1% annually.
- Compared to the EU, Japan saw lower inflation, while the US and China had higher rates.
- In 2023, the EU’s inflation rate was 6.4%, the second-highest in ten years.
- It’s vital for households and businesses in Europe to understand the effects of inflation.
Inflation: A Decade in Review
The Rollercoaster of EU Inflation
Over the last decade, EU inflation went down between 2014 and 2015, hitting a low of 0.1% in 2015. It rose slightly to 0.2% in 2016.2 The average inflation rate went up to 1.7% in 2017 and to 1.9% in 2018. Then, it dropped to 1.5% in 2019.2 After hitting 0.7% in 2020, it jumped to 2.9% in 2021. This led to a peak of 9.2% in 2022.
These rates show us that the lowest EU inflation figures were seen from 2014-2016. Prices picked up from 2017 to 2019. In 2020, due to COVID-19 measures, they dropped. but then surged in 2021 and tripled in 2022.
In 2023, it reached 6.4%. This was the second highest rate between 2014 and 2023.2
Comparative Consumer Price Developments
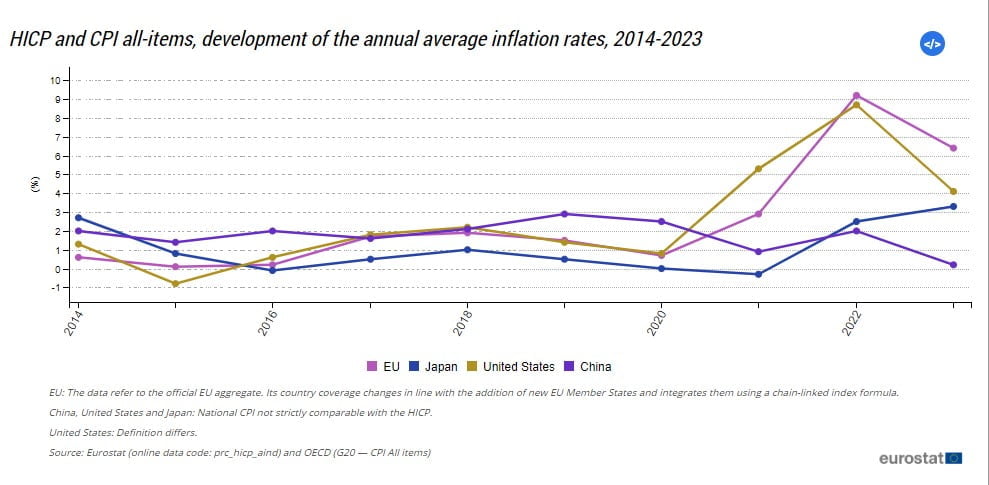
Figure 1 outlines consumer price changes in some of the biggest economies. It shows that prices in Japan were lower than in the EU. But, they were higher in the United States and China from 2014-2020.2 Over the period 2014-2023, consumer prices went up by 0.9% yearly in Japan. They rose by 2.8% in the United States and 1.7% in China.2
Country-Specific Inflation Trajectories
Hungary, Estonia, and Lithuania Lead the Charge
Hungary, Estonia, and Lithuania saw big inflation leaps in the EU from 2014 to 2023. Hungary topped the list with a 60.7% increase. Estonia was next at 49.6%, closely followed by Lithuania at 48.5%.3 In 2023, Hungary’s consumer prices surged by 17.0%. Czechia then Slovakia saw increases of 12.0% and 11.0%, respectively.3
The Outliers: Cyprus, Belgium, and Luxembourg
Cyprus, however, had the smallest jump in inflation rates, increasing by just 12.7% over the decade.3 In 2023, the countries with the lowest inflation were Belgium at 2.3%, Luxembourg at 2.9%, and Denmark and Spain both at 3.4%.
Product Categories and Inflation Rates
In the EU, food and non-alcoholic drinks prices jumped the most in 2023. They went up by 12.6% on average.4 Next, restaurants and hotels prices rose by 8.4%. Alcoholic drinks and tobacco increased by 7.8%.4
But, the cost of communications only ticked up by 1.1%.4 Here’s the surprise: Everything else saw prices grow. These included categories like transportation, health, and energy. Their prices went up by 2.5% to 6.8% on average in 2023.4
Food and Beverages: The Highest Increases
From 2014 to 2023, food and drinks without alcohol got much pricier in the EU. Their prices rose by 39.6%.4 Alcoholic drinks and tobacco came next, also increasing by 37.0%.4
Meanwhile, the cost of communications went down by 3.3% during this time.4
Communications: A Deflationary Trend
The inflation across different product categories varied.4 Some went up a lot, others went down, and some just changed slightly.
Inflation Rates in Europe
The Harmonized Index of Consumer Prices (HICP) is a key measure for tracking consumer goods and services prices. It focuses on what households usually buy. However, items like drugs, owned homes, and gambling costs are not included. This is because they’re hard to price, they aren’t sold directly, or there’s no clear pricing method for them.
HICPs help us compare price changes across many places, like the euro area and the EU. These measurements use a shared year as a starting point. This makes it easy to see how prices are changing over time.1
By March 2024, it’s predicted that inflation in the euro area will reach 2.4%. This is mainly because the cost of services is going up (by 4.0%). Food, drinks, and tobacco will also be more expensive, increasing by 2.7%. Things like clothes and appliances will see modest price hikes of 1.1%. But, energy prices are expected to drop by 1.8%.5 These changes will mean that in March 2024, inflation across Europe will vary a lot, from as low as 0.3% to as high as 4.9% for different goods and services.5
The euro area includes 19 countries, such as Germany, France, Italy, and Spain. This group uses the same HICP data for their economic plans. Every month, the HICP for the EU and the euro area gets updated. The first info comes out around the middle of the next month, and it gets finalized later on.5
The Welfare Impact of Inflation
During 2021-22, an unexpected rise in inflation hit many euro area households hard. It caused a drop in their real incomes and wealth. This was because their wages, pension, and house values didn’t go up immediately with the price level.6 Such changes affected both current and future spending, influencing their overall quality of life.
Reduced Real Incomes and Net Wealth
Income-wise, the impact was heavier on poorer families. But the big hit was taken by retirees. Their savings didn’t keep up with the rising prices, so they lost out significantly.6 Younger families, however, saw a silver lining. Their debts became easier to handle.
Not everyone lost with this inflation surge. Some families actually saw slight gains, particularly those not heavily indebted. Around 70% of households were worse off, though.
Age-Dependent Taxation Effect
The inflation’s effect varied across the board. The median household in the euro area lost about 4% of their disposable income during this time – more than a typical recession.
This economic setback hit retirees the hardest. With their significant savings, they faced substantial losses. On the flip side, families with debts found some relief as their debts were easier to manage due to inflation.6
This set a scenario almost like taxing based on age. Also, the slow increase in wages and pensions really pinched everyone. This included a 4% loss in income, affecting the median household.6
Evaluating the Effects of Inflation on Welfare
A Transitory Inflation Shock
For thirty years, inflation was low and steady in advanced nations. But after the COVID-19 pandemic, prices spiked sharply. In October 2022, inflation in the euro area hit 10.6%.6 The biggest drivers were energy and food costs. We look at this inflation burst as temporary. We expect real wages, real asset prices, and all goods prices to stabilize post-2022.
Due to this outlook, the negative impact on welfare from slow wage and house price adjustments is also temporary. For people selling property, the delay in prices going up is bothersome, but it’s short-lived. Importantly, there’s a permanent hit for assets and debts figured in fixed money amounts (nominally).
The Distribution of Welfare Costs
In 2021-22, the inflation hit households hard but not equally. The median euro area household saw their welfare drop by about 4% of what they could spend. This was way more than in a typical recession.6. Retirees felt the biggest impact. This is because they usually have a lot of savings and cash, which lose value when prices rise. On the other hand, families with big debts, like home loans, saw some benefits. The money they owed got less valuable because of inflation.6
Retirees Bear the Brunt
For middle-income retirees, things were especially tough. They lost the equivalent of 11% of their yearly income due to inflation. Part of the problem was that wages and pensions didn’t go up quickly enough to match the rising prices6. This slow wage and pension change also caused a 4% income loss for other age groups.
The Role of Nominal Assets and Liabilities
There’s an interesting twist. While retirees lost out because their savings were worth less, people with big loans benefited. The loans they were paying shrank in real value due to inflation6.
But the situation wasn’t all bad for those with savings. They got hit the most by inflation. Still, pension and wage adjustments that were too slow caused a 4% welfare loss for most households6. For retirees, these losses were even larger because their incomes didn’t keep up with rising prices6.
Consumption Basket Variations
Different households have seen various inflation rates because of what they buy. This situation led to smaller widespread effects.6 Poorer families lost more compared to wealthier ones. Food and energy prices went up, hitting them hard. Yet, the rise in prices was balanced by lower real estate rents. This meant that the effect was less than if all wealth and incomes had decreased.6 Changes to home and stock values barely affected the situation.
| Country | Welfare Loss for Median Household |
|---|---|
| France | 3% of disposable income |
| Spain | 3% of disposable income |
| Italy | 8% of disposable income |
In France and Spain, the median household lost around 3% of its income due to inflation. In Italy, this loss was much higher, at 8%.6 The gap between countries was mainly due to different inflation rates and how wealth was distributed.
Young households in debt saw benefits as their debts’ value went down. In France and Spain, where many young people owe on mortgages, this was more noticeable. But, not owning a home and owing money could hit young people hard.
The Role of Fiscal Policies
In Europe, when inflation shot up, various quick solutions were tried. These included setting caps on energy prices and giving subsidies. Also, cuts in fuel taxes dropped what people paid. Plus, money was directly given to those in need. Even though these moves added to the debt, they didn’t make inflation worse.7
Energy Price Caps and Subsidies
These special fiscal policies helped soften the shock for families, especially the at-risk ones. They cut the financial hit from inflation by 2% for most homes. It was the retired who saw the biggest improvement. They spend more on energy and were hurt most by rising prices.8 The main help came from the energy-focused policies, not the cash given directly to families.8
Direct Transfers to Households
The impact was big, with Europe’s governments spending nearly 2% of GDP in 2022 to tackle the crisis. Many tactics were used, including giving direct cash to families. This move lessened the blow for the most vulnerable. In the end, these steps were key in making the inflation hit softer for Europeans.87
Country Comparisons Within the Euro Area
Differences in welfare costs are seen across the larger euro area countries. For the median household, welfare losses ranged from 3% in France and Spain to 8% in Italy.9 These differences were mainly due to country-specific inflation rates plus variations in net wealth distribution. They were also influenced by different fiscal policies.9
France and Spain vs. Italy
Younger families with debts saw benefits. This was because their debt’s real value went down.9 It was more noticeable in France and Spain. That’s where many young families have home loans.9 But, not all benefited. Those without a mortgage saw lower welfare.
The Mortgage Effect for Young Households
Younger families in debt found a silver lining. Their debt’s real value decreased.9 This situation favored those in France and Spain, especially with mortgages.9 Nevertheless, young families without mortgages faced decreased welfare.
Conclusion
Looking at the euro area, the 2021-22 inflation spike led to big welfare losses. These losses were huge when compared to what a typical recession costs. Also, each country saw inflation’s effects differently.
Across different ages, impacts varied a lot. But, these differences were not based on how much people earn. Unconventional fiscal steps really helped. They lessened inflation’s impact on households.
This situation shows how crucial fiscal policy is in a monetary union. In these unions, individual countries can’t adjust the monetary policy. So, fiscal measures are necessary to deal with specific country issues.
The conclusion on inflation impact in europe tells us a lot. The 2021-22 surge really hit people hard. There were big losses, and different countries felt it in their unique ways. Age also played a part. Unusual fiscal policies were a big help. They made the hit less severe for families.6
It highlights the importance of using both monetary and fiscal tools in a big group of countries. Without them working together, it’s harder to soften the blow of inflation.
Inflation didn’t affect everyone the same way. Different countries and different families felt it differently. Using fiscal tools was key to soften these blows. Policymakers can learn a lot from this. They can make better plans next time to help families and keep the economy steady.61011
FAQ
What were the trends in EU inflation over the last decade?
From 2014 to 2015, EU inflation dropped, hitting a low of 0.1%. It bumped up to 0.2% in 2016. However, by 2019, it fell to 1.5%. The year 2020 saw a big drop to 0.7%.
In 2021, inflation soared to 2.9%. It then hit a record high of 9.2% in 2022.
How did inflation rates compare across different countries and regions?
In Japan, prices rose less compared to the EU from 2014 to 2020. The United States and China saw higher increases. Japan’s prices went up by 0.9% yearly. The US had a 2.8% rise, and China saw a 1.7% increase.
Which EU Member States experienced the highest and lowest overall increases in the HICP between 2014 and 2023?
Between 2014 and 2023, Hungary, Estonia, and Lithuania noted the highest increases. Hungary led with a 60.7% hike. Estonia and Lithuania followed with 49.6% and 48.5%, respectively. Yet, Cyprus had the lowest rise at 12.7%.
Which product categories saw the highest and lowest price increases in the EU in 2023?
In 2023, food prices and non-alcoholic beverages went up the most, by 12.6%. Restaurants and hotels increased by 8.4%. Alcoholic drinks and tobacco rose by 7.8%. Communication costs only inched up by 1.1%.
What were the key drivers of the 2021-22 inflation surge in the euro area?
The inflation surge between 2021 and 2022 surprised many. It hit households hard in the euro area. The main culprits were rising prices in food and energy.
How did the welfare impact of the inflation surge differ across households?
Retirees suffered the most from the inflation spike. Their big savings just weren’t worth as much. Meanwhile, those with mortgages were a bit luckier. Their debt felt smaller due to the inflation. Everyone, though, felt the pain of not having pay rises or pension bumps in a timely manner.
What role did fiscal policies play in cushioning the effects of the inflation shock?
To help out during the inflation shock, governments did a few things. They capped energy prices and gave out subsidies. They also sent direct money to those who needed it most. This helped protect the most vulnerable people.
How did the welfare costs of the inflation surge differ across the larger euro area countries?
Welfare losses varied from 3% in France and Spain to 8% in Italy. This was because of different inflation rates and how wealth was distributed. Also, varying fiscal policies played a big role in these differences.
Source Links
- https://www.euronews.com/business/2024/03/05/inflation-in-europe-which-countries-have-the-highest-and-lowest-inflation-rates
- https://www.nytimes.com/2023/11/30/business/eurozone-inflation-november.html
- https://www.imf.org/en/News/Articles/2023/10/18/sp-laura-papi-remarks-at-budapest-economic-forum
- https://ec.europa.eu/eurostat/statistics-explained/index.php/Consumer_prices_-_inflation
- https://ec.europa.eu/eurostat/web/products-euro-indicators/w/2-03042024-ap
- https://www.ecb.europa.eu/press/research-publications/resbull/2024/html/ecb.rb240220~a77abebe0e.en.html
- https://www.ecb.europa.eu/press/economic-bulletin/articles/2023/html/ecb.ebart202302_01~2bd46eff8f.en.html
- https://cepr.org/voxeu/columns/how-fiscal-policy-offset-negative-welfare-effect-euro-area-inflation
- https://www.euro-area-statistics.org/digital-publication/statistics-insights-inflation/bloc-1b.html
- https://www.cnb.cz/en/about_cnb/cnblog/Inflation-rates-in-Europe-An-explanation-of-the-differences-using-different-price-levels-and-energy-intensities/
- https://www.imf.org/en/Blogs/Articles/2023/06/26/europes-inflation-outlook-depends-on-how-corporate-profits-absorb-wage-gains