The whole world relies heavily on oil. Every day, we use a massive 97 million barrels globally.1 America is the top consumer, using 20.3% of the world’s oil. That’s equal to 19,687,287 barrels a day.1 China follows, using 13.2% with 12,791,553 barrels a day.1 India comes next, using 4.6% or 4,443,000 barrels a day.1
Global Oil Consumption By Country
| # | Country | Daily Oil Consumption (barrels) | World Share | Yearly Gallons Per Capita |
| 1 | United States | 19,687,287 | 20.3 % | 922.4 |
| 2 | China | 12,791,553 | 13.2 % | 139.9 |
| 3 | India | 4,443,000 | 4.6 % | 50.9 |
| 4 | Japan | 4,012,877 | 4.1 % | 484.4 |
| 5 | Russia | 3,631,287 | 3.7 % | 383.6 |
| 6 | Saudi Arabia | 3,302,000 | 3.4 % | 1,514.8 |
| 7 | Brazil | 2,984,000 | 3.1 % | 221.1 |
| 8 | South Korea | 2,605,440 | 2.7 % | 778.4 |
| 9 | Canada | 2,486,301 | 2.6 % | 1,055.4 |
| 10 | Germany | 2,383,393 | 2.5 % | 443.8 |
| 11 | Mexico | 2,052,607 | 2.1 % | 258.9 |
| 12 | Iran | 1,803,999 | 1.9 % | 332.0 |
| 13 | France | 1,705,568 | 1.8 % | 408.6 |
| 14 | Indonesia | 1,623,000 | 1.7 % | 95.0 |
| 15 | United Kingdom | 1,583,896 | 1.6 % | 369.8 |
| 16 | Singapore | 1,357,000 | 1.4 % | 3,642.0 |
| 17 | Thailand | 1,302,000 | 1.3 % | 282.7 |
| 18 | Spain | 1,290,063 | 1.3 % | 425.5 |
| 19 | Italy | 1,236,628 | 1.3 % | 315.3 |
| 20 | Australia | 1,114,645 | 1.1 % | 706.2 |
| 21 | Taiwan | 981,203 | 1.0 % | 637.5 |
| 22 | Turkey | 941,861 | 1.0 % | 178.2 |
| 23 | Netherlands | 937,098 | 1.0 % | 838.9 |
| 24 | United Arab Emirates | 896,000 | 0.9 % | 1,527.2 |
| 25 | Egypt | 877,000 | 0.9 % | 134.7 |
| 26 | Iraq | 857,000 | 0.9 % | 339.5 |
| 27 | Argentina | 709,000 | 0.7 % | 248.9 |
| 28 | Malaysia | 708,000 | 0.7 % | 344.3 |
| 29 | South Africa | 640,000 | 0.7 % | 173.9 |
| 30 | Belgium | 631,522 | 0.7 % | 855.5 |
| 31 | Venezuela | 598,000 | 0.6 % | 298.2 |
| 32 | Poland | 582,161 | 0.6 % | 231.6 |
| 33 | Pakistan | 556,000 | 0.6 % | 39.9 |
| 34 | Vietnam | 478,000 | 0.5 % | 78.7 |
| 35 | Algeria | 429,000 | 0.4 % | 163.0 |
| 36 | Philippines | 429,000 | 0.4 % | 62.7 |
| 37 | Nigeria | 428,000 | 0.4 % | 34.8 |
| 38 | Hong Kong | 408,491 | 0.4 % | 842.2 |
| 39 | Kuwait | 359,000 | 0.4 % | 1,359.5 |
| 40 | Colombia | 357,000 | 0.4 % | 114.9 |
| 41 | Chile | 351,989 | 0.4 % | 298.4 |
| 42 | Kazakhstan | 325,000 | 0.3 % | 275.6 |
| 43 | Sweden | 322,109 | 0.3 % | 496.1 |
| 44 | Greece | 296,101 | 0.3 % | 422.3 |
| 45 | Morocco | 275,000 | 0.3 % | 120.1 |
| 46 | Austria | 262,352 | 0.3 % | 460.4 |
| 47 | Ecuador | 259,000 | 0.3 % | 241.5 |
| 48 | Peru | 246,000 | 0.3 % | 121.1 |
| 49 | Ukraine | 244,000 | 0.3 % | 83.4 |
| 50 | Portugal | 236,866 | 0.2 % | 351.4 |
| 51 | Israel | 236,249 | 0.2 % | 443.9 |
| 52 | Switzerland | 228,194 | 0.2 % | 417.8 |
| 53 | Libya | 223,000 | 0.2 % | 544.2 |
| 54 | Finland | 210,030 | 0.2 % | 585.9 |
| 55 | Norway | 204,090 | 0.2 % | 597.5 |
| 56 | Romania | 200,000 | 0.2 % | 154.9 |
| 57 | Oman | 183,000 | 0.2 % | 637.9 |
| 58 | Czech Republic (Czechia) | 179,956 | 0.2 % | 262.0 |
| 59 | Qatar | 172,000 | 0.2 % | 1,016.0 |
| 60 | New Zealand | 166,913 | 0.2 % | 548.1 |
| 61 | Denmark | 158,194 | 0.2 % | 424.9 |
| 62 | Hungary | 155,544 | 0.2 % | 242.9 |
| 63 | Panama | 155,000 | 0.2 % | 590.2 |
| 64 | Lebanon | 153,000 | 0.2 % | 374.8 |
| 65 | Cuba | 153,000 | 0.2 % | 206.8 |
| 66 | Ireland | 152,404 | 0.2 % | 495.4 |
| 67 | Turkmenistan | 149,000 | 0.2 % | 389.2 |
| 68 | Syria | 140,000 | 0.1 % | 113.2 |
| 69 | Sudan | 140,000 | 0.1 % | 54.5 |
| 70 | Belarus | 137,000 | 0.1 % | 216.3 |
| 71 | Dominican Republic | 133,000 | 0.1 % | 193.7 |
| 72 | Angola | 133,000 | 0.1 % | 69.9 |
| 73 | Sri Lanka | 127,000 | 0.1 % | 90.9 |
| 74 | Myanmar | 123,000 | 0.1 % | 36.3 |
| 75 | Jordan | 114,000 | 0.1 % | 175.4 |
| 76 | Kenya | 114,000 | 0.1 % | 36.5 |
| 77 | Bangladesh | 113,000 | 0.1 % | 10.8 |
| 78 | Bulgaria | 97,000 | 0.100 % | 205.2 |
| 79 | Tunisia | 97,000 | 0.100 % | 127.3 |
| 80 | Puerto Rico | 96,746 | 0.100 % | 432.1 |
| 81 | Azerbaijan | 96,000 | 0.099 % | 147.5 |
| 82 | Guatemala | 93,000 | 0.096 % | 87.5 |
| 83 | Bolivia | 90,000 | 0.093 % | 122.5 |
| 84 | Ghana | 88,000 | 0.091 % | 45.6 |
| 85 | Slovakia | 81,587 | 0.084 % | 230.3 |
| 86 | Gibraltar | 75,000 | 0.077 % | 35,306.3 |
| 87 | Serbia | 74,000 | 0.076 % | 151.4 |
| 88 | Ethiopia | 74,000 | 0.076 % | 10.8 |
| 89 | Tanzania | 71,999 | 0.074 % | 20.3 |
| 90 | Croatia | 69,000 | 0.071 % | 250.4 |
| 91 | Bahrain | 62,000 | 0.064 % | 674.2 |
| 92 | Lithuania | 61,612 | 0.063 % | 322.0 |
| 93 | Yemen | 60,000 | 0.062 % | 31.4 |
| 94 | Honduras | 58,000 | 0.060 % | 94.0 |
| 95 | Trinidad and Tobago | 57,000 | 0.059 % | 594.7 |
| 96 | Luxembourg | 56,194 | 0.058 % | 1,476.7 |
| 97 | Costa Rica | 55,000 | 0.057 % | 170.5 |
| 98 | Jamaica | 54,000 | 0.056 % | 295.4 |
| 99 | Uruguay | 53,000 | 0.055 % | 238.0 |
| 100 | Slovenia | 52,298 | 0.054 % | 383.6 |
| 101 | Cyprus | 52,000 | 0.054 % | 665.5 |
| 102 | El Salvador | 52,000 | 0.054 % | 127.5 |
| 103 | Paraguay | 51,000 | 0.053 % | 124.8 |
| 104 | Côte d’Ivoire | 51,000 | 0.053 % | 32.3 |
| 105 | Senegal | 49,000 | 0.050 % | 50.9 |
| 106 | Uzbekistan | 49,000 | 0.050 % | 23.9 |
| 107 | Cambodia | 48,000 | 0.049 % | 47.1 |
| 108 | Malta | 47,000 | 0.048 % | 1,540.5 |
| 109 | Nepal | 43,000 | 0.044 % | 23.7 |
| 110 | Kyrgyzstan | 40,000 | 0.041 % | 101.9 |
| 111 | Cameroon | 40,000 | 0.041 % | 25.9 |
| 112 | Mozambique | 40,000 | 0.041 % | 22.1 |
| 113 | Latvia | 37,694 | 0.039 % | 292.8 |
| 114 | Papua New Guinea | 37,001 | 0.038 % | 63.7 |
| 115 | Nicaragua | 37,000 | 0.038 % | 88.8 |
| 116 | Benin | 36,000 | 0.037 % | 49.0 |
| 117 | Bosnia and Herzegovina | 35,000 | 0.036 % | 154.1 |
| 118 | Afghanistan | 35,000 | 0.036 % | 15.5 |
| 119 | Georgia | 33,000 | 0.034 % | 134.1 |
| 120 | Uganda | 32,001 | 0.033 % | 12.7 |
| 121 | Estonia | 28,855 | 0.030 % | 336.2 |
| 122 | Mauritius | 28,000 | 0.029 % | 331.7 |
| 123 | Albania | 27,000 | 0.028 % | 143.7 |
| 124 | Namibia | 26,000 | 0.027 % | 171.6 |
| 125 | State of Palestine | 24,001 | 0.025 % | 80.1 |
| 126 | Zimbabwe | 24,000 | 0.025 % | 25.5 |
| 127 | Haiti | 23,000 | 0.024 % | 32.9 |
| 128 | Burkina Faso | 23,000 | 0.024 % | 18.3 |
| 129 | Zambia | 22,000 | 0.023 % | 20.1 |
| 130 | Mali | 21,999 | 0.023 % | 18.0 |
| 131 | Gabon | 21,000 | 0.022 % | 154.3 |
| 132 | North Macedonia | 21,000 | 0.022 % | 152.6 |
| 133 | Botswana | 21,000 | 0.022 % | 136.9 |
| 134 | Mongolia | 21,000 | 0.022 % | 106.3 |
| 135 | Tajikistan | 21,000 | 0.022 % | 36.9 |
| 136 | DR Congo | 21,000 | 0.022 % | 4.0 |
| 137 | Bahamas | 20,036 | 0.021 % | 775.7 |
| 138 | New Caledonia | 20,000 | 0.021 % | 1,080.5 |
| 139 | Iceland | 19,090 | 0.020 % | 871.8 |
| 140 | Guinea | 19,001 | 0.020 % | 24.4 |
| 141 | Moldova | 18,001 | 0.019 % | 85.6 |
| 142 | Laos | 18,000 | 0.019 % | 40.0 |
| 143 | North Korea | 18,000 | 0.019 % | 10.9 |
| 144 | Madagascar | 18,000 | 0.019 % | 10.8 |
| 145 | Réunion | 17,999 | 0.019 % | 297.8 |
| 146 | Macao | 17,110 | 0.018 % | 418.5 |
| 147 | Mauritania | 17,000 | 0.018 % | 64.3 |
| 148 | Congo | 17,000 | 0.018 % | 50.2 |
| 149 | Martinique | 16,999 | 0.018 % | 685.2 |
| 150 | U.S. Virgin Islands | 16,440 | 0.017 % | 2,463.1 |
| 151 | Brunei | 16,000 | 0.016 % | 575.8 |
| 152 | Fiji | 16,000 | 0.016 % | 267.1 |
| 153 | Togo | 15,000 | 0.015 % | 30.0 |
| 154 | Guyana | 14,000 | 0.014 % | 282.7 |
| 155 | Guadeloupe | 13,000 | 0.013 % | 500.9 |
| 156 | Suriname | 13,000 | 0.013 % | 342.7 |
| 157 | Guam | 12,570 | 0.013 % | 1,144.6 |
| 158 | Niger | 12,000 | 0.012 % | 8.8 |
| 159 | Barbados | 11,001 | 0.011 % | 605.2 |
| 160 | Maldives | 11,000 | 0.011 % | 371.2 |
| 161 | South Sudan | 8,001 | 0.0082 % | 11.1 |
| 162 | Aruba | 8,000 | 0.0082 % | 1,169.4 |
| 163 | Liberia | 8,000 | 0.0082 % | 26.1 |
| 164 | Seychelles | 7,299 | 0.0075 % | 1,113.3 |
| 165 | Montenegro | 7,000 | 0.0072 % | 169.5 |
| 166 | Rwanda | 6,700 | 0.0069 % | 8.6 |
| 167 | French Polynesia | 6,599 | 0.0068 % | 344.6 |
| 168 | Sierra Leone | 6,500 | 0.0067 % | 13.3 |
| 169 | Djibouti | 6,360 | 0.0065 % | 95.3 |
| 170 | Malawi | 6,001 | 0.0062 % | 5.3 |
| 171 | Armenia | 6,000 | 0.0062 % | 32.1 |
| 172 | Cabo Verde | 5,600 | 0.0058 % | 153.7 |
| 173 | Somalia | 5,600 | 0.0058 % | 6.0 |
| 174 | Eswatini | 5,300 | 0.0055 % | 71.1 |
| 175 | Equatorial Guinea | 5,200 | 0.0054 % | 57.0 |
| 176 | Antigua and Barbuda | 5,001 | 0.0052 % | 846.5 |
| 177 | Lesotho | 5,001 | 0.0052 % | 35.8 |
| 178 | Bermuda | 5,000 | 0.0051 % | 1,215.4 |
| 179 | French Guiana | 5,000 | 0.0051 % | 291.7 |
| 180 | Faeroe Islands | 4,600 | 0.0047 % | 1,424.6 |
| 181 | Cayman Islands | 4,401 | 0.0045 % | 1,083.7 |
| 182 | Belize | 4,001 | 0.0041 % | 167.0 |
| 183 | Greenland | 4,000 | 0.0041 % | 1,096.6 |
| 184 | Gambia | 3,800 | 0.0039 % | 25.1 |
| 185 | Timor-Leste | 3,501 | 0.0036 % | 43.8 |
| 186 | Saint Lucia | 3,099 | 0.0032 % | 269.3 |
| 187 | Bhutan | 3,001 | 0.0031 % | 61.4 |
| 188 | Eritrea | 3,000 | 0.0031 % | 13.7 |
| 189 | Central African Republic | 2,800 | 0.0029 % | 8.8 |
| 190 | Guinea-Bissau | 2,700 | 0.0028 % | 22.6 |
| 191 | Samoa | 2,400 | 0.0025 % | 179.0 |
| 192 | American Samoa | 2,375 | 0.0024 % | 721.7 |
| 193 | Chad | 2,299 | 0.0024 % | 2.4 |
| 194 | Grenada | 2,000 | 0.0021 % | 255.6 |
| 195 | Western Sahara | 1,701 | 0.0018 % | 51.6 |
| 196 | Saint Kitts & Nevis | 1,700 | 0.0018 % | 545.3 |
| 197 | St. Vincent & Grenadines | 1,619 | 0.0017 % | 234.2 |
| 198 | Solomon Islands | 1,600 | 0.0016 % | 39.1 |
| 199 | Burundi | 1,499 | 0.0015 % | 2.1 |
| 200 | Turks and Caicos | 1,420 | 0.0015 % | 569.2 |
| 201 | Dominica | 1,301 | 0.0013 % | 284.6 |
| 202 | Comoros | 1,300 | 0.0013 % | 26.7 |
| 203 | British Virgin Islands | 1,240 | 0.0013 % | 639.2 |
| 204 | Vanuatu | 1,100 | 0.0011 % | 59.5 |
| 205 | Sao Tome & Principe | 1,000 | 0.0010 % | 74.9 |
| 206 | Tonga | 899 | 0.00093 % | 130.4 |
| 207 | Saint Pierre & Miquelon | 660 | 0.00068 % | 1,696.2 |
| 208 | Cook Islands | 600 | 0.00062 % | 524.2 |
| 209 | Nauru | 469 | 0.00048 % | 628.6 |
| 210 | Montserrat | 400 | 0.00041 % | 1,205.9 |
| 211 | Kiribati | 400 | 0.00041 % | 51.7 |
| 212 | Falkland Islands | 290 | 0.00030 % | 1,267.3 |
| 213 | Saint Helena | 70 | 0.00007 % | 194.8 |
| 214 | Niue | 51 | 0.00005 % | 420.1 |
Key Takeaways
- The United States is the world’s largest oil consumer, accounting for 20.3% of global consumption.
- China is the second-largest oil consumer, representing 13.2% of global consumption.
- India is the third-largest oil consumer, responsible for 4.6% of global consumption.
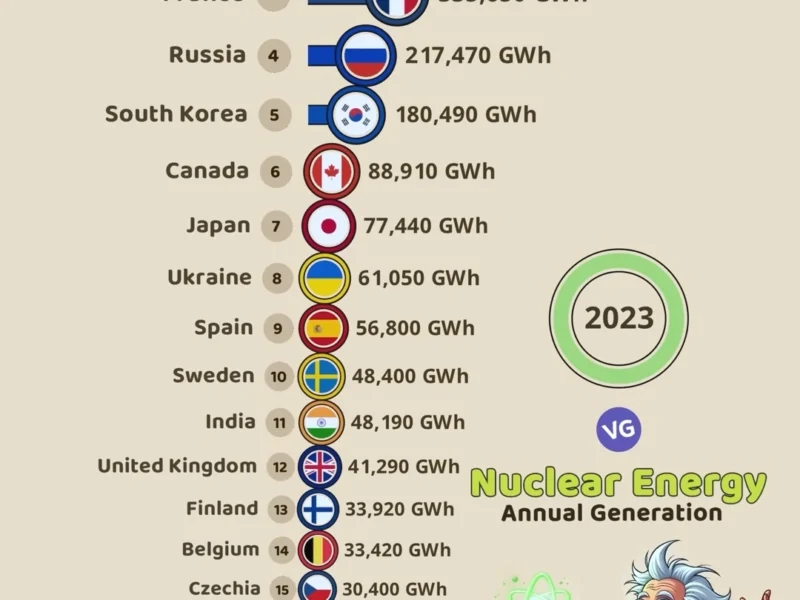
- The top five oil-consuming countries also include Japan and Russia.
- Oil consumption is closely tied to factors such as economic development, population size, and transportation needs.
Global Oil Consumption Overview
The world’s oil use is a big part of how we get energy globally. A few countries are leading the way. The United States uses the most oil, with 19,687,287 barrels daily, which is 20.3% of the world’s use.1 Right after is China, using 12,791,553 barrels each day, making up 13.2%.1
Top Oil-Consuming Countries
After the U.S. and China, top oil users include India, Japan, and Russia. They use 4,443,000, 4,012,877, and 3,631,287 barrels per day, respectively.1 The demand from these nations shapes the world’s need for oil.1
Regional Breakdown of Oil Consumption
The U.S. and China lead in global oil use, but there are fascinating trends at the local level. For example, Singapore’s people use a lot of oil for their size. They consume 3,642.0 gallons a year, with a daily use of 1,357,000 barrels.1 Also, Luxembourg and Kuwait have very high yearly oil use per person, at 1,476.7 and 1,359.5 gallons.1
Historical Trends and Projections
Looking into the future, global oil use will keep growing. By 2024, it’s expected to go up by 1.1 million barrels daily, and then by 1.5 million in 2025.2 Non-OECD countries, especially China and India, will drive this growth.2
United States: The Largest Oil Consumer
The United States is the top oil user globally, using 19,687,287 barrels daily. This makes up 20.3% of the world’s oil use.1 Its huge need for oil comes from its big economy and its vast transport system, along with making a lot of its own oil.
Domestic Production and Imports
The U.S. also produces the most oil, around 11.5 million barrels daily, and uses the most, over 17 million per day.3 Even with a lot of local oil, it still brings in oil to meet its energy needs.
Sectors Contributing to Oil Consumption
Many areas use a lot of oil in the U.S., like transportation, factories, and homes and businesses. This is mainly because the big fleet of vehicles uses a lot of oil.1 And, factories and other energy-heavy industries also add to the need for oil.
Because the U.S. uses the most oil globally,4 it’s important to know why. This helps in making better energy plans, finding new ways to meet energy needs, and creating alternative energy sources.
China: The Second-Largest Oil Consumer
China is the second-largest economy globally. Its oil use significantly affects the global energy scene. It consumes the second-most oil, using 12,791,553 barrels daily, or about 13.2% of the world’s consumption.1 China’s fast economic growth and industrial move impact this figure. As a result, the country’s energy demand has shot up in all sectors.1
Economic Growth and Energy Demand
China’s growth involves building industries and cities. This has boomed its need for oil. More people and a bigger middle class mean a higher demand for cars, production, and power generation.5 Each person in China uses 139.9 gallons of oil a year, showing how much they depend on oil.1
Now, China aims to use more clean energy. But, most vehicles, ships, and planes still run on oil. This keeps its oil use large.5 Also, China turns crude oil into many products it needs. This makes its oil use even more significant.5
The top oil consumer is the United States, which uses 19,687,287 barrels daily, making up 20.3% of world use.1 India comes next after China, using 4,443,000 barrels a day, or 4.6% of the total.1 China uses much more oil than Japan and South Korea combined, which use less altogether.1
China’s oil use relates to its fast economic and industrial growth. This positions it as the global runner-up in oil use.15 The country needs to find ways to ensure it has enough energy. It should also look into using more sustainable energy options to meet its increasing needs.
India: The Third-Largest Oil Consumer
India stands as the world’s third-largest oil consumer, using 4,443,000 barrels every day. This makes up 4.6% of the world’s oil use.1 Its oil demand grows due to a fast-growing economy, increased industrialization, and a larger population.
Rapid Industrialization and Population Growth
India’s quick industrialization and growing population push its need for oil up.6 Experts predict India will use more oil, reaching 6.64 million barrels a day by 2030.6 This rise comes as the nation builds more cities and needs more oil for its factories and transport.
Energy Policies and Renewable Initiatives
India is taking steps to tackle its rising oil use. It’s working on different energy policies and focusing on renewable sources.6 Since India relies on importing 85% of its oil, it plans to cut this dependency by expanding its renewable power sources.6 The country aims to use more solar and wind power, plus increase its energy efficiency. It will also use new fuels like biofuels to lessen its oil needs.

oil consumption per country
Analyzing oil consumption patterns worldwide shows huge differences between countries. The United States, China, and India are the top oil-consuming nations. They use a big part of the world’s oil.1
Factors Influencing Oil Consumption Patterns
Oil consumption patterns change because of several important aspects. These include a country’s size, how developed it is, its need for transportation, and the policies on energy.1 These factors cause the world to see different levels of oil consumption per country.
Top Oil-Consuming Countries per Capita
While the United States, China, and India are the top consumers overall, per capita oil consumption gives us a different view. Singapore and the United States have high per capita oil consumption. Yet nations like Somalia, Botswana, and Cyprus use less oil per person.1
The study shows many factors affect oil consumption by country. This proves we need a varied approach to tackle the world’s energy issues and push for sustainable energy solutions.147
Middle East and OPEC Nations
The Middle East and OPEC (Organization of the Petroleum Exporting Countries) nations are key players in the world’s oil market.8 Countries like Saudi Arabia, Iran, Iraq, and the United Arab Emirates are leading consumers. They both use a lot of oil themselves and sell it abroad.8
Oil Production and Domestic Consumption
The Middle East stands as a major oil producer. Nearly forty percent of the world’s oil comes from OPEC members.9 In 2023, the U.S. was the top oil producer followed by Russia.10 Saudi Arabia, part of OPEC, was also among the top five oil producers globally, with a significant daily output.10
Despite their massive oil production, these countries also use a lot of oil domestically.8 In 2022, the top 10 consumers made up 61% of the global oil use. Among them, the U.S., China, and India stood out.8
Economic Diversification Efforts
For years, the Middle East and OPEC nations have heavily relied on oil exports. But, they are working to change this by broadening their economic activities.9 OPEC along with Russia and others formed the OPEC+ coalition in 2019 to better manage oil production and price stability.9 Saudi Arabia, a major OPEC player, is also focusing on non-oil sectors to lessen its oil income dependency.9
The shift toward economic diversity by the Middle East and OPEC members is critical. It comes amid oil price swings and a global move to renewable energy.8109 These efforts are aiming for more stable and varied economies.
European Union: Striving for Energy Efficiency
The European Union (EU) ranks as the second-largest oil user worldwide. Yet, it’s working hard to cut back on oil and other fossil fuels. In 2022, the EU saw a 2.8% drop in the energy used by people and a 4% decrease in the energy it mainly uses. This dip is mainly due to the high prices of gas. These high prices are making the EU look for smarter, more energy-saving ways. Plus, they’re focusing more on renewables.11
Renewable Energy Targets
The EU has big goals for using more renewable energy. In 2021, 43.2% of the main energy came from renewable sources. This made it the largest source of energy. Member states like Sweden and France are showing the way by using a lot of renewable energy. To boost this further, the EU is aiming to hit specific targets by 2030. They want to cut how much energy is used and grow the use of renewable sources.12
The goals are to have a final energy consumption of 763Mtoe and a primary energy consumption of 992.5Mtoe by then. This shows the EU is really serious about cutting back on energy use and going greener.
Emissions Reduction Goals
The EU is also aiming to slash the amount of greenhouse gases it puts out. They want to use 20% less energy by the year 2020. These steps come from the Energy Efficiency Directive. It’s part of the EU’s plans to fight climate change. Now, it’s looking towards its goals for 2030 and beyond. All these moves are helping the EU and the world move towards a more eco-friendly future.11
Emerging Economies and Oil Demand
In countries like India, China, and many in Southeast Asia, Africa, and Latin America, fast growth is happening.1 This growth means more people live in cities, more industries develop, and more goods move around. Oil consumption boosts thanks to these changes.
Urbanization and Transportation Needs
More and more people move to cities in these growing places. This means the need for cars, trucks, and buses increases.1 Airplanes and ships are also needed more to move both people and products.13 Because not many other energy sources are available yet, these places use a lot of oil.
Energy Security Concerns
Places on the rise worry about getting enough energy to keep up their growth.1 Since they often buy more oil than they sell, they face risks from oil price changes and supply issues.14 To become safer, they look into getting energy from different places and using more clean options.

This rise in oil use is big news for the world’s energy scene. It affects how we think about energy rules, the environment’s health, and how much oil we have.11314 As these new economies change, they will help decide our energy future.
Environmental Impact of Oil Consumption
Global oil consumption affects the environment a lot. It leads to high carbon emissions, causing climate change. The more oil we burn, the more greenhouse gases we release. These gases warm the Earth, creating global warming.15
Carbon Emissions and Climate Change
Since 1950, our use of fossil fuels has skyrocketed, eight times over. Since 1980, it has doubled. This quick jump in oil use means more carbon emissions. Oil is a big player in the climate change problem. Different countries use different amounts of fossil fuels. The biggest users use over ten times what the smallest ones use.15
About 80% of our energy comes from coal, oil, and gas across the world. While coal use is dropping, oil and gas use is going up. This increase worsens the environment.15
Alternative Energy Solutions
The world is turning to alternative energies to lessen the harm from oil. Solar, wind, and hydropower are getting better and cheaper. Many countries are also aiming to stop using coal for electricity by 2030 or 2040. They want to lower their carbon footprints.15
Moving towards cleaner, sustainable energies is key. It helps fight climate change and cuts down on the damage from oil use. As we work to meet our energy needs while protecting the environment, turning to these new options is a critical step. It’s crucial for a greener future.15
Conclusion
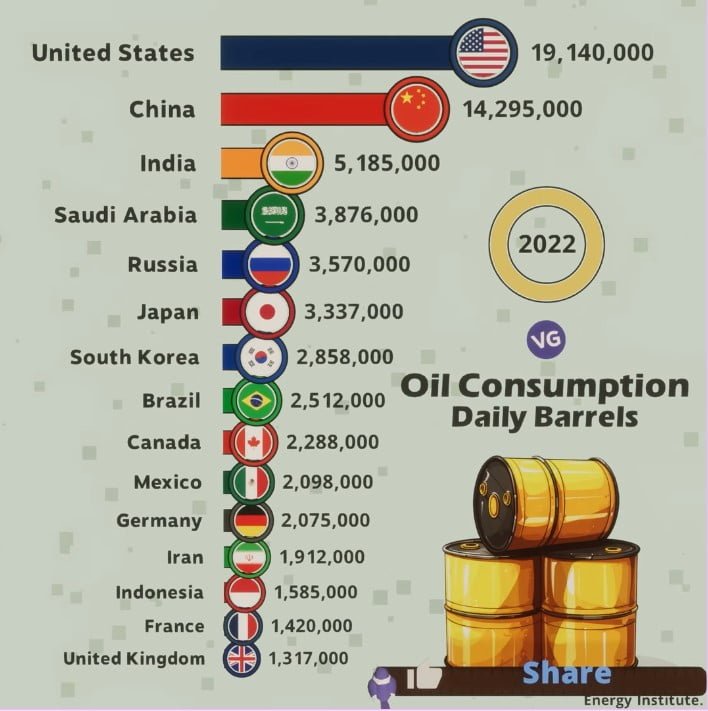
The use of oil around the world shows how important it is for our energy needs. The top consumers are the United States, China, and India. They use most of the world’s oil.16 In 2022, U.S.A. used the most oil, around 19.1 million barrels per day. China followed with 14.3 million barrels per day.16 Global oil production was 93.8 million barrels each day in 2022. This was 3.8 million more than in 2021. But, the world used more, reaching 97.3 million barrels per day.16
The amount of liquid fuels we produce is expected to go up. In three years, it could be 104.7 million barrels a day.2 At the same time, people will use more oil. By 2025, we might use 104.5 million barrels every day.2 This increase is because many countries in Asia and Africa are growing. They need more energy for their development.
Yet, using oil affects the environment a lot. It causes a lot of carbon emissions, leading to climate change. That’s why many countries are looking for cleaner energy options. They’re focusing on renewable energy, making energy use more efficient, and finding new ways to travel without using oil.2 This change marks a move towards a more sustainable future with less impact on the planet.
FAQ
What are the top 5 oil-consuming countries in the world?
The top 5 oil-consuming countries are:
1. United States: 19,687,287 barrels per day
2. China: 12,791,553 barrels per day
3. India: 4,443,000 barrels per day
4. Japan: 4,012,877 barrels per day
5. Russia: 3,631,287 barrels per day. This data shows the world’s top oil users.
Why is the United States the world’s largest oil consumer?
The United States leads in oil consumption. It uses 19,687,287 barrels daily. This is because of its big economy and need for oil in the transport sector. Also, the U.S. produces a lot of oil at home.
How does China’s oil consumption compare to the rest of the world?
China is second in oil use globally at 12,791,553 barrels daily. This is due to its strong economic growth. The demand for energy has gone up a lot.
What factors contribute to India’s high oil consumption?
India comes third in oil use with 4,443,000 barrels a day. Its economy is fast-growing, and so is its population. Both need more oil.
How does the Middle East and OPEC nations impact global oil consumption?
The Middle East and OPEC countries are key in oil use and production. Countries like Saudi Arabia and Iran are big oil consumers and exporters. They affect the global oil market a lot.
What is the European Union’s role in global oil consumption?
The EU is the world’s second-biggest oil consumer. It uses about 15 million barrels daily. Even so, the EU is trying hard to use less oil by pushing energy efficiency and renewable energy.
How are emerging economies affecting global oil consumption patterns?
Places like India, China, and Southeast Asia are using more oil as they grow. More cities, more industry, and more people mean more oil is needed.
What are the environmental implications of high global oil consumption?
Using a lot of oil is bad for the environment. It causes a lot of carbon emissions. These emissions warm the planet and are a big part of climate change.
Source Links
- https://www.worldometers.info/oil/oil-consumption-by-country/
- https://www.eia.gov/outlooks/steo/report/global_oil.php
- https://worldpopulationreview.com/country-rankings/oil-consumption-by-country
- https://en.wikipedia.org/wiki/List_of_countries_by_oil_consumption
- https://www.iea.org/countries/china/oil
- https://m.economictimes.com/industry/energy/oil-gas/india-to-be-largest-global-oil-demand-growth-driver-through-2030-iea/articleshow/107480937.cms
- https://ourworldindata.org/grapher/per-capita-oil
- https://www.eia.gov/TOOLS/FAQS/faq.php?id=709&t=6
- https://www.cfr.org/backgrounder/opec-changing-world
- https://en.wikipedia.org/wiki/List_of_countries_by_oil_production
- https://www.eea.europa.eu/en/analysis/indicators/primary-and-final-energy-consumption
- https://ec.europa.eu/eurostat/statistics-explained/index.php/Energy_statistics_-_an_overview
- https://www.iea.org/commentaries/oil-demand-growing-at-a-slower-pace-as-post-covid-rebound-runs-its-course
- https://www.eia.gov/finance/markets/crudeoil/demand-oecd.php
- https://ourworldindata.org/fossil-fuels
- https://www.forbes.com/sites/rrapier/2023/08/18/the-us-still-leads-in-global-petroleum-production–consumption/