The world’s solar power capacity has grown a lot in recent years1. Now, the top countries for solar energy are China, the United States, Japan, Germany, and India. China is leading with over 390 GW of solar power, making up almost half of the world’s solar capacity1. The United States has 113 GW, Japan, Germany, and India have 83 GW, 66 GW, and 63 GW, respectively2. These countries are growing their solar energy to meet more electricity needs and use less fossil fuel.
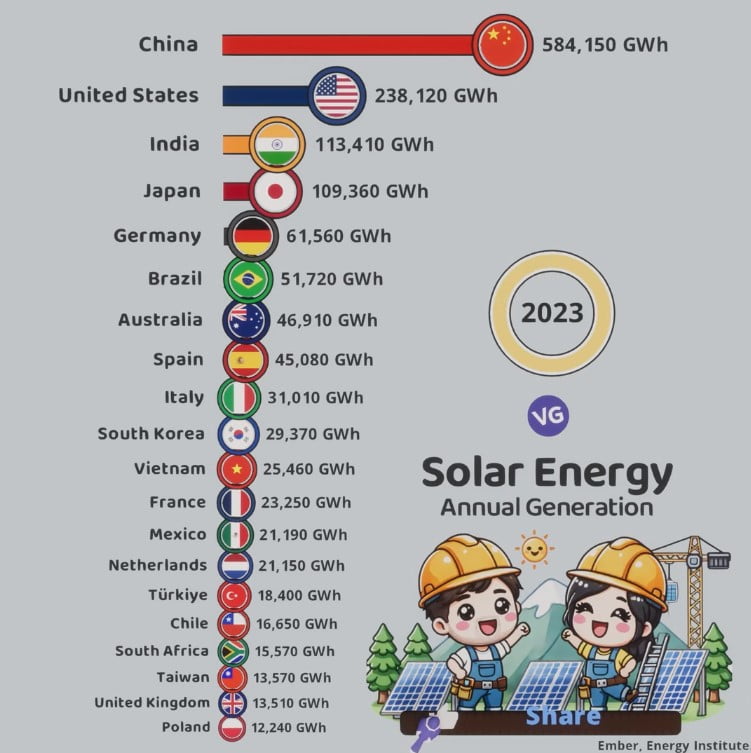
The Countries that Generate the Most Solar Energy 2023
| Country | Flag | Generation (GWh) |
|---|---|---|
| China | 🇨🇳 | 584,150 |
| United States | 🇺🇸 | 238,120 |
| India | 🇮🇳 | 113,410 |
| Japan | 🇯🇵 | 109,360 |
| Germany | 🇩🇪 | 61,560 |
| Brazil | 🇧🇷 | 51,720 |
| Australia | 🇦🇺 | 46,910 |
| Spain | 🇪🇸 | 45,080 |
| Italy | 🇮🇹 | 31,010 |
| South Korea | 🇰🇷 | 29,370 |
| Vietnam | 🇻🇳 | 25,460 |
| France | 🇫🇷 | 23,250 |
| Mexico | 🇲🇽 | 21,190 |
| Netherlands | 🇳🇱 | 21,150 |
| Türkiye | 🇹🇷 | 18,400 |
| Chile | 🇨🇱 | 16,650 |
| South Africa | 🇿🇦 | 15,570 |
| Taiwan | 🇹🇼 | 13,570 |
| United Kingdom | 🇬🇧 | 13,510 |
| Poland | 🇵🇱 | 12,240 |
Key Takeaways
- China leads the world in solar power capacity with 390 GW, accounting for two-fifths of global installed solar capacity.
- The United States, Japan, Germany, and India are the other top solar energy-producing countries, with significant installed capacities.
- These nations have been aggressively expanding their solar infrastructure to meet growing energy demands and reduce fossil fuel dependence.
- More than 40 countries now have over 1 GW of cumulative PV capacity, including Canada, South Africa, Chile, and the UK.
- Solar power generation has the potential to provide all electricity needs for nearly every country based on geographic conditions and sunlight availability.
Introduction to Solar Energy
Solar energy turns sunlight into electrical energy3. It’s a huge source of energy, with about 1,366 watts per square meter hitting the Earth3. There are two main ways to use solar power: photovoltaic (PV) systems and concentrated solar power (CSP) systems3.
Solar Energy Annual Generation in 2023
Source: Ember, Energy Institute
.
What is Solar Energy?
The sun’s radiation creates solar energy through a nuclear fusion process at its core3. The Solar Concepts eLearning course teaches about insolation data and how to set up solar panels3. Solar power is growing fast worldwide, with many countries using it to lessen their reliance on traditional energy.
Benefits of Solar Energy
Solar energy is clean and doesn’t emit greenhouse gases or air pollutants4. It’s becoming cheaper than traditional energy, making it great for homes and big projects alike4. Solar energy can quickly reach remote areas, giving people access to power4. Its costs are dropping and its efficiency is rising, leading to its fast growth globally.
“Solar energy is the most abundant source of energy on Earth, with the potential to meet the world’s energy needs many times over.”
China – The Undisputed Solar Leader
China leads the world in solar energy, with 393 GW of solar capacity by 2022. This makes up almost half of the world’s solar power5. The country has been growing its solar power fast, adding over 100 GW in 20225. This growth is thanks to strong government support, good policies, and a strong solar manufacturing industry.
China’s Installed Solar Capacity
China is a giant in renewable energy, investing more than Europe and the U.S combined5. The International Renewable Energy Association (IRENA) says China will make up 40% of the world’s renewable energy growth by 20205. By 2030, China plans to invest USD 145 billion a year in renewable energy, totaling USD 2.2 trillion5.
Future Goals for Solar Power in China
China aims to grow its solar energy even more in the future. By 2025, 33% of its electricity will come from renewable sources5. President Xi Jinping also plans to develop 1,200 GW of solar and wind energy by 20305. These goals show China’s move away from fossil fuels and its leading role in solar power.
United States – The Second Largest Solar Producer
The United States is the second-biggest producer of6 solar energy worldwide. It has an installed solar capacity of 113 GW as of 20226. Solar power makes up about 4.8% of the country’s electricity6. From 2008 to today, the US solar market has grown a lot, going from 0.34 GW to over 100 GW6.
This growth is thanks to cheaper solar panels, good policies at the federal and state levels, and more people and companies wanting6 renewable energy.
Even with this growth, the US is still behind China in solar capacity7. The states vary in their solar energy production, from 2nd to 51st place7. The number of homes with solar energy also varies a lot, from 190 to over 600,000 per state7. The amount of electricity from solar also changes a lot, from 0.01% to 12.77% across states7.
Despite this, the US is aiming to use more6 renewable energy. It wants renewable energy to make up 25% of its electricity by 20256. Using more renewable energy can cut down on CO2 emissions in transport, heating, and electricity6. The US is in a good spot to take advantage of this chance as it grows its6 solar power.
| Metric | Value |
|---|---|
| Installed Solar Capacity (2022) | 113 GW6 |
| Solar Share of Electricity Generation | 4.8%6 |
| Growth in Solar Capacity (2008-2022) | 0.34 GW to over 100 GW6 |
| Renewable Energy Share of Electricity (2022) | 21%6 |
| Renewable Energy Share of Total Energy (2022) | 8.4%6 |
The United States is set to keep growing in6 solar power and6 renewable energy. This growth can help reduce emissions and meet its clean energy goals.
Japan – A Rapidly Growing Solar Market
Japan is now the third-largest producer of solar energy worldwide, with 83 GW of solar capacity installed by 20228. Solar power makes up almost 10% of Japan’s electricity8. It also leads in making solar panels, creating 45% of the world’s photovoltaic cells8.
Japan’s Solar Manufacturing Prowess
The solar market in Japan has grown fast, thanks to government support and a push for energy diversity after Fukushima8. Japan aims to increase solar capacity by 20 GW by 2030, aiming for 108 GW8.
Japan’s solar manufacturing is key to its global leadership. Its tech and quality solar products make it a big exporter of solar parts8.
“Japan was only investing significantly in solar power in 2010, falling behind other industrialized countries in renewable energy development.”
But Japan has caught up, thanks to its strong solar manufacturing. Its focus on sustainable energy and manufacturing skills make it a big player in solar energy worldwide8.

The Countries that Generate the Most Solar Energy
The world is seeing a big change in solar power, with many countries making big moves towards using the sun’s energy. By 2022, over 40 countries had reached more than 1 GW in solar PV capacity. This shows how widely solar technology is being used9.
China, the United States, India, Japan, and Brazil lead in solar energy. They are key players in the solar revolution, adding a lot to solar power growth10.
In Europe, countries like the Netherlands, France, Germany, and Spain are big on solar power. Solar energy makes up 9% to 14% of their yearly electricity use9. Australia, Honduras, Italy, and Greece are also making big moves in solar energy, adding to the global picture9.
The growth of solar power shows its big benefits for the environment and economy. As technology gets better and costs go down, solar energy is set to be a big part of the world’s energy mix10.
| Country | Installed Solar Capacity (GW) | Solar Energy Generation (% of Total) |
|---|---|---|
| China | 308.3 | 3.9% |
| United States | 95.0 | 5.0% |
| India | 59.9 | 4.0% |
| Japan | 71.2 | 7.6% |
| Brazil | 21.1 | 2.4% |
Solar power is growing all over the world, with countries investing in this clean energy source10. As we move towards a sustainable future, these leading countries in solar energy will play a big role11.
Germany – Leading the Way in Europe
Germany is a leader in solar energy in Europe. It has 66 GW of solar capacity as of 2021, the most on the continent12. In 2022, solar power made up 10.7% of Germany’s electricity, showing its big role in energy12.
The Ukraine war has led to an energy crisis, making Germany focus on renewable energy. This includes more solar power12. The goal is to install 215 GW of solar capacity by 2030 for net-zero emissions by 204512.
Germany’s Solar Energy Targets
Germany is setting big goals for solar energy12. The solar panel market in Europe is set to grow from $35.2 billion in 2023 to $62.8 billion by 203113. This growth is key for Germany’s move to a sustainable future.
The EU saw a 47% jump in new solar capacity in 2022, reaching 41.4 GW13. Europe’s solar capacity is expected to hit 259.99 GW by 2023, with solar making up 9.1% of electricity13.
Germany is leading Europe’s solar energy push. Its targets and the growth of the European solar market look promising for renewable energy’s future1213.

India – Harnessing Its Vast Solar Potential
India is a powerhouse in solar energy, ranking fifth globally with over 63 GW of solar capacity by 202214. Its sunny climate, with over 300 days of sun a year, makes it perfect for solar power15. The government is pushing hard to use more solar energy and make more products in India.
India’s Domestic Solar Manufacturing Plans
The government has launched a Performance Linked Incentive (PLI) scheme to boost solar panel production14. India wants to hit 280 GW of solar power by 2030, and the PLI will help achieve this14. Also, 42 solar parks have been set up to make more land available for solar projects14.
India aims to cut down on solar imports and build a strong solar industry14. From 2010 to 2019, foreign investors put almost $20.7 billion into India’s solar projects14. With government support and its huge solar potential, India is set to lead in solar energy production and manufacturing.
“India’s Photovoltaic Electricity Potential was estimated to be around 5,000 trillion kilowatt-hours per year, surpassing the possible energy output of all fossil fuel reserves in the country.”14
Global Solar PV Potential and Insolation Map
The world has a huge solar energy potential, with some places getting a lot more sunlight than others16. Areas near the equator, like parts of Africa, the Middle East, and South America, get the most sunlight16. Other top spots include the southwestern United States, parts of Australia, and southern Europe16.
Photovoltaic solar energy has a huge potential worldwide, bigger than other renewable sources17. China is leading with over 200 GW of solar installations17. The total investment in solar systems is over 600 GW worldwide17.
How well solar power plants work can change a lot based on where they are17. For example, a solar plant in Algeria was very efficient, over 80%17. But it lost power a bit faster, at 0.76% each year17. In contrast, a desert PV array was 90% efficient17.
Researchers use deep learning to predict where solar PV plants will work best, helping with decisions17. They also look at how the weather might change and affect solar power, making sure we can rely on it17.
This map shows where it’s best for big solar power projects, helping leaders make smart choices about renewable energy16.
| Country | Installed Solar PV Capacity (GW) |
|---|---|
| China | 200+ |
| United States | 75+ |
| Japan | 60+ |
| Germany | 55+ |
| India | 40+ |
As we move to renewable energy, the solar PV map will guide big decisions and investments in solar power1617.
“The sun’s energy is the foundation of all life on Earth, and harnessing its power is essential for a sustainable future.”
Top Solar Countries by Installed Capacity
The world is embracing solar energy at a fast pace, with many countries boosting their solar power. The top 10 countries with the most solar PV capacity are:
- China (393 GW)18
- United States (113 GW)18
- Japan (83 GW)18
- Germany (66 GW)18
- India (63 GW)18
- Italy (25 GW)18
- Australia (29 GW)18
- Vietnam (18 GW)18
- South Korea (24 GW)18
- Spain (20 GW)18
Recent Growth in Solar PV Capacity
Solar PV capacity has grown a lot in the last ten years. It went from 14,725 MW in 2008 to 713,970 MW in 2020, almost 48 times more18. This growth is thanks to cheaper solar panels, good policies, and more investment in clean energy18.
Even with a price jump in solar modules in 2021, the world still added 133 GW of solar capacity that year18. The top five countries for solar power in 2021 were China, the USA, Japan, India, and Germany, making 67.4% of all solar electricity18.
“Solar energy is growing fast, with the International Energy Agency expecting a 60% increase in renewable capacity by 2026. Solar PV energy will make up 1100 GW of that.”18
The future looks bright for solar power, with predictions that the world will see a lot more solar PV capacity. Bloomberg expects it to hit 14,000 GW by 205018. Solar power is leading the way in renewable energy.
Conclusion
Solar energy is now key to the world’s energy needs. Countries are quickly adding solar power to their energy mix. This move helps them switch from fossil fuels19. The Solar Power Generation Systems market is set to jump from USD million in 2023 to USD million by 202919. The US & Canada, China, and Europe will see big increases in this time19.
China, the US, Japan, Germany, and India lead in solar production. They’ve invested a lot in solar PV and CSP tech. This has made solar energy cheaper and more efficient20. By 2012, the world had over 100,000 megawatts of solar power installed20. Solar energy is growing fast as it becomes more affordable and widely available.
Solar energy is becoming a bigger part of the world’s energy. Its share of electricity generation is expected to rise. The sun’s energy potential in sunny areas offers hope for a greener energy future. This supports the solar energy growth, renewable energy transition, and global solar power outlook.
FAQ
What are the top countries that generate the most solar energy in the world?
The top countries for solar energy are China, the United States, Japan, Germany, and India. They lead in harnessing solar power.
What is solar energy and how is it harnessed?
Solar energy turns sunlight into electrical energy. It uses photovoltaic (PV) and concentrated solar power (CSP) technologies. PV converts sunlight directly into electricity. CSP uses solar heat to make steam and power turbines.
What are the benefits of solar energy compared to fossil fuels?
Solar energy is clean and renewable, unlike fossil fuels. It doesn’t emit greenhouse gases or air pollutants. It’s also becoming cheaper, making it a good choice for homes and large-scale use. Solar power can quickly provide energy to remote areas too.
Why is China the global leader in solar energy?
China leads in solar energy with 393 GW of capacity as of 2022. This is nearly 40% of the world’s solar power. Its growth is fast, thanks to strong government support and a strong solar industry.
How does the United States rank in terms of solar energy production?
The United States is second in solar energy production, with 113 GW of capacity in 2022. Solar power makes up about 4.8% of the country’s electricity. The US has seen a big increase in solar power, growing from 0.34 GW in 2008 to over 100 GW now.
What is Japan’s role in the global solar energy landscape?
Japan is a major producer of solar energy, with 83 GW of capacity as of 2022. Solar power is nearly 10% of Japan’s electricity. Japan is also a big producer of solar cells, making 45% of the world’s supply. Its solar market has grown fast, thanks to government support and the need for diverse energy sources after the Fukushima disaster.
Which other countries are significant players in the global solar energy market?
Over 40 countries have more than 1 GW of solar PV capacity. Countries like Canada, South Africa, Chile, the UK, South Korea, Austria, Argentina, and the Philippines are among them. In 2022, the top solar installers were China, the United States, India, Japan, Brazil, the Netherlands, France, Mexico, and Germany.
How does Germany’s solar energy sector compare to other European countries?
Germany is a solar energy leader in Europe, with 66 GW of capacity as of 2021. Solar power made up 10.7% of Germany’s electricity use in 2022. The government is now focusing on expanding renewable energy, including solar, to reduce dependence on Russian gas due to the Ukraine war.
What is India’s solar energy potential and what is the country doing to harness it?
India is a top five producer of solar energy, with over 63 GW of capacity as of 2022. It has a huge solar potential, with most areas getting over 300 days of sunshine a year. India is boosting its solar sector with policies and initiatives, including the Performance Linked Incentive (PLI) scheme, to reduce imports and use more domestic solar manufacturing.
How does the global solar PV potential and insolation map help identify the best regions for solar power projects?
The solar PV potential map shows that areas near the equator get the most sunlight. This includes parts of Africa, the Middle East, and South America. Other good regions are the southwestern US, parts of Australia, and southern Europe. This map helps find the best places for large-scale solar projects.
Source Links
- Solar power by country – https://en.wikipedia.org/wiki/Solar_power_by_country
- Solar Power by Country 2024 – https://worldpopulationreview.com/country-rankings/solar-power-by-country
- Solar Concepts eLearning | Basic Concepts in Solar Energy & Technology – Amatrol – https://amatrol.com/product/solar-concepts-multimedia-m20016/
- 50 Solar Energy Facts, Statistics, and Charts [2019] | Eco Planeta Caribe – https://ecoplaneta.com/solar-energy-facts/
- PDF – https://www.ualberta.ca/china-institute/media-library/media-gallery/research/energy-reports/2016cleantechrenewableenergy.pdf
- Renewable energy in the United States – https://en.wikipedia.org/wiki/Renewable_energy_in_the_United_States
- State-By-State Map | SEIA – https://www.seia.org/states-map
- Can Japan Go 100% Renewable by 2050? – https://ourworld.unu.edu/en/can-japan-go-100-renewable-by-2050
- Solar generation was 3% of U.S. electricity in 2020, but we project it will be 20% by 2050 – U.S. Energy Information Administration (EIA) – https://www.eia.gov/todayinenergy/detail.php?id=50357
- Tripling renewable power capacity by 2030 is vital to keep the 1.5°C goal within reach – Analysis – IEA – https://www.iea.org/commentaries/tripling-renewable-power-capacity-by-2030-is-vital-to-keep-the-150c-goal-within-reach
- Here’s how renewables have grown so far in 2023 – https://electrek.co/2023/10/04/heres-how-renewables-have-grown-so-far-in-2023/
- European Electricity Review 2023 | Ember – https://ember-climate.org/insights/research/european-electricity-review-2023/
- Europe Solar Panel Market Size, Share & Industry Trends, 2031 – https://www.persistencemarketresearch.com/market-research/europe-solar-panel-market.asp
- Solar power in India – https://en.wikipedia.org/wiki/Solar_power_in_India
- Just Transition Research Centre IIT Kanpur on LinkedIn: #solarenergy #india #justtranstition – https://www.linkedin.com/posts/just-transition-research-centre-iit-kanpur_solarenergy-india-justtranstition-activity-7112825823451058176-zWdH
- A bibliometric evaluation and visualization of global solar power generation research: productivity, contributors and hot topics – https://www.ncbi.nlm.nih.gov/pmc/articles/PMC10821997/
- A countrywide analysis of 27 solar power plants installed at different climates – Scientific Reports – https://www.nature.com/articles/s41598-021-04551-7
- A Review on Solar Energy Policy and Current Status: Top 5 Countries and Kazakhstan – https://www.mdpi.com/1996-1073/16/11/4370
- Solar Power Generation Systems Market 2023 Size, Insights, Forecast to 2030| 107 Pages Report – https://www.linkedin.com/pulse/solar-power-generation-systems-market-2023-size-5jzye
- PDF – https://doe.gov.ph/sites/default/files/pdf/netmeter/policy-brief-its-more-sun-in-the-philippines-V3.pdf