The 2023 data on global plastic exports reveals a compelling story about international trade patterns, manufacturing capabilities, and economic priorities in an increasingly complex global marketplace. As plastic products remain essential components in nearly every industry – from consumer goods and packaging to medical supplies and construction – understanding which nations dominate this export sector provides valuable insights into global economic dynamics.
| Rank | Country | Export Value ($) |
|---|---|---|
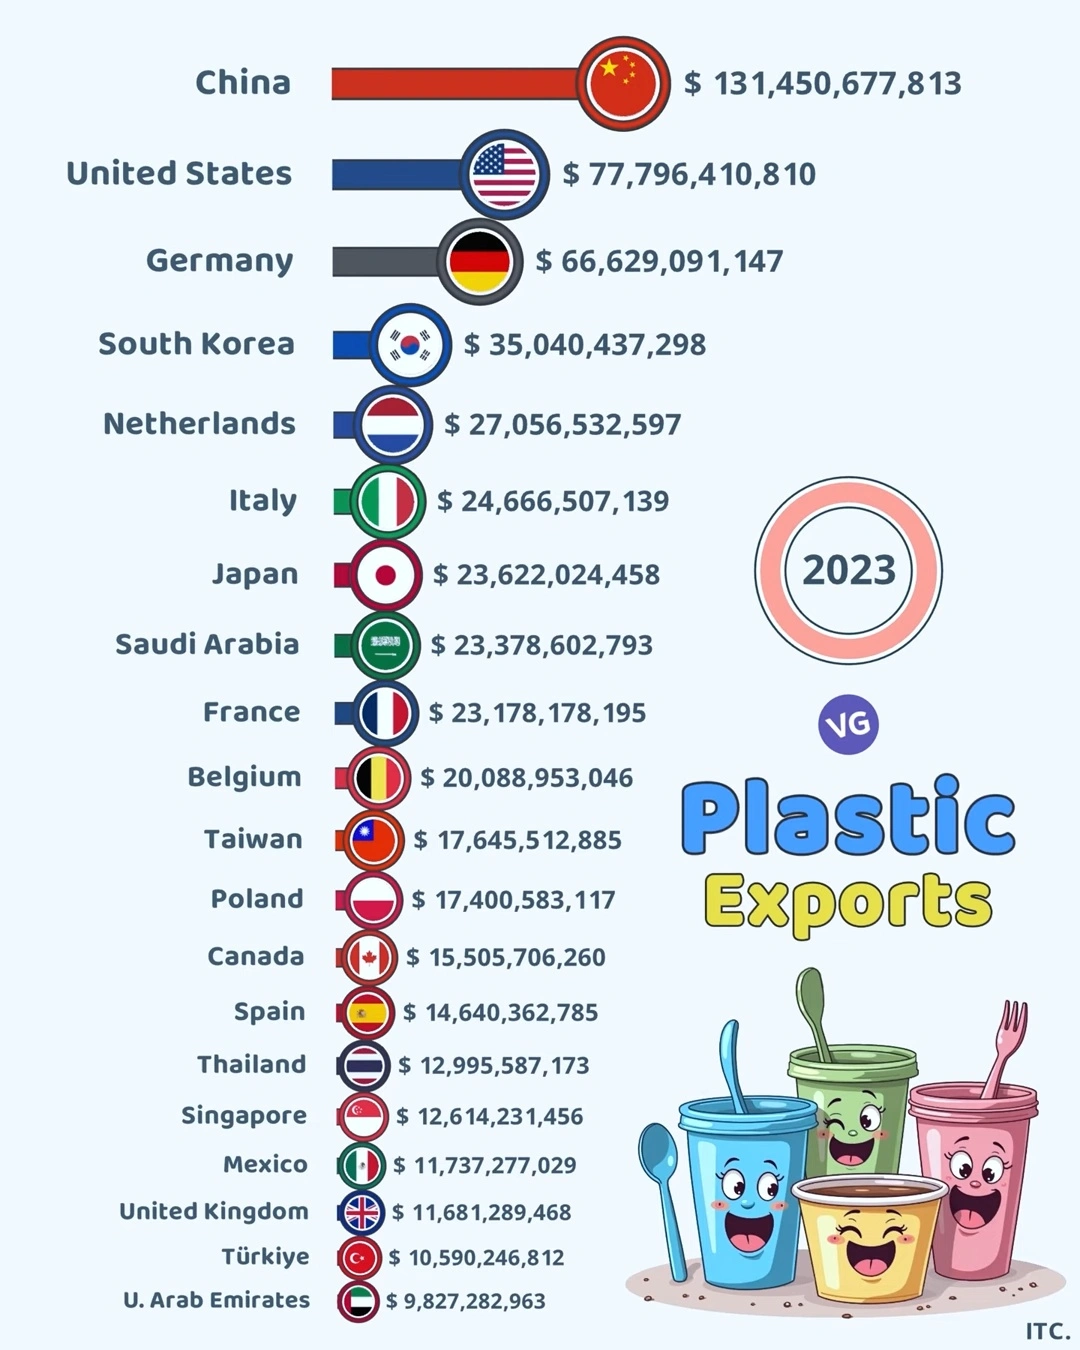
| 1 🇨🇳 | China | 131,450,677,813 |
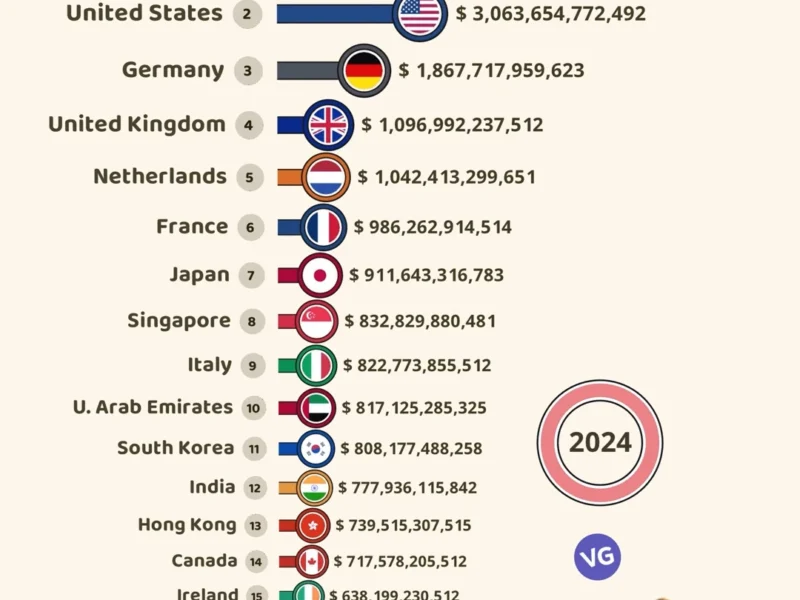
| 2 🇺🇸 | United States | 77,796,410,810 |
| 3 🇩🇪 | Germany | 66,629,091,147 |
| 4 🇰🇷 | South Korea | 35,040,437,298 |
| 5 🇳🇱 | Netherlands | 27,056,532,597 |
| 6 🇮🇹 | Italy | 24,666,507,139 |
| 7 🇯🇵 | Japan | 23,622,024,458 |
| 8 🇸🇦 | Saudi Arabia | 23,378,602,793 |
| 9 🇫🇷 | France | 23,178,178,195 |
| 10 🇧🇪 | Belgium | 20,088,953,046 |
| 11 🇹🇼 | Taiwan | 17,645,512,885 |
| 12 🇵🇱 | Poland | 17,400,583,117 |
| 13 🇨🇦 | Canada | 15,505,706,260 |
| 14 🇪🇸 | Spain | 14,640,362,785 |
| 15 🇹🇭 | Thailand | 12,995,587,173 |
| 16 🇸🇬 | Singapore | 12,614,231,456 |
| 17 🇲🇽 | Mexico | 11,737,277,029 |
| 18 🇬🇧 | United Kingdom | 11,681,289,468 |
| 19 🇹🇷 | Türkiye | 10,590,246,812 |
| 20 🇦🇪 | U. Arab Emirates | 9,827,282,963 |
The Dominant Exporters: A Clear Hierarchy
The data presents a distinct hierarchy in the plastic export market, with China leading by a substantial margin at $131.45 billion. This represents approximately 23% of the total exports among the top 20 countries listed, demonstrating China’s overwhelming manufacturing capacity and export infrastructure. The United States follows at $77.79 billion, while Germany maintains a strong third position with $66.63 billion.
Regional Patterns and Economic Clusters
Several fascinating regional patterns emerge from this data:
European Union Strength
The collective strength of EU nations is remarkable, with Germany, Netherlands, Italy, France, Belgium, Poland, and Spain all appearing in the top 15 exporters. Together, these seven EU countries account for approximately $194 billion in plastic exports, demonstrating the bloc’s industrial capability and integrated supply chains.
East Asian Manufacturing Hubs
Beyond China’s dominant position, several East Asian economies feature prominently: South Korea ($35.04 billion), Japan ($23.62 billion), Taiwan ($17.64 billion), Thailand ($12.99 billion), and Singapore ($12.61 billion). This regional concentration reflects decades of strategic investment in petrochemical industries and manufacturing sectors.
North American Representation
The United States and Canada ($15.50 billion) together contribute about $93.3 billion, showing North America’s significant but not dominant position in this market.
Economic Implications
The distribution of plastic exports reveals several important economic trends:
- Industrial Base Correlation: Countries with strong manufacturing sectors and petrochemical industries naturally dominate the plastic export market.
- Value Chain Positioning: Higher-ranking countries typically produce more sophisticated, higher-value plastic products, while others may focus on raw materials or simpler components.
- Trade Relationship Dependencies: The data indirectly highlights important trade relationships, as major exporters must have established markets for their plastic products.
Sustainability Considerations
While the data provides economic insights, it also raises important questions about sustainability. As global attention to plastic pollution grows, these leading exporters face increasing pressure to:
- Develop more recyclable and biodegradable alternatives
- Establish circular economy models for plastic products
- Address potential regulatory changes in import markets concerned about plastic waste
Looking Forward: Market Evolution
Several factors will likely influence future plastic export patterns:
- Sustainability Regulations: Countries that adapt quickest to stricter environmental standards may gain competitive advantages.
- Oil Price Fluctuations: As a petroleum-derived product, plastic production costs and competitiveness remain tied to oil markets.
- Reshoring Trends: Some manufacturing may return to consumer markets due to shipping costs and supply chain resilience concerns.
- Alternative Materials: The development of bioplastics and other alternatives could reshape competitive advantages.
Conclusion
The 2023 plastic export data reveals a market dominated by established industrial powers, with China leading by a significant margin. However, the collective strength of the European Union and the focused manufacturing capabilities of East Asian economies create a complex competitive landscape.
As sustainability concerns grow and manufacturing technologies evolve, this export landscape will likely undergo significant shifts in the coming decade. Companies, investors, and policymakers would be wise to monitor not just the volume of plastic exports, but also innovations in materials, manufacturing processes, and circular economy models that could reshape competitive advantages in this essential global market.