The global value of soft drinks shipped rose by an average 22.2% for all exporting countries compared to 5 years earlier in 2018. That year, soft drinks sold internationally were valued at $21.8 billion1. By 2022, international sales of exported soft drinks reached US$26.7 billion1. The value of these exports stayed steady in 2022, showing a 1.1% increase from the year before to $26.4 billion1.
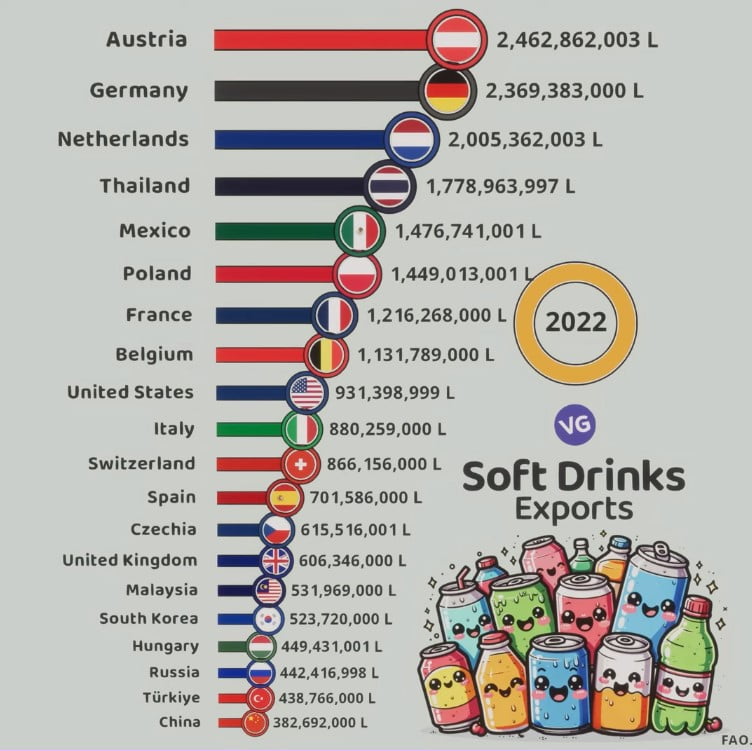
The Largest Soft Drink Exporters in the World 2022
| Country | Flag | Exports (Liters) |
|---|---|---|
| Austria | 🇦🇹 | 2,462,862,003 |
| Germany | 🇩🇪 | 2,369,383,000 |
| Netherlands | 🇳🇱 | 2,005,362,003 |
| Thailand | 🇹🇭 | 1,778,963,997 |
| Mexico | 🇲🇽 | 1,476,741,001 |
| Poland | 🇵🇱 | 1,449,013,001 |
| France | 🇫🇷 | 1,216,268,000 |
| Belgium | 🇧🇪 | 1,131,789,000 |
| United States | 🇺🇸 | 931,398,999 |
| Italy | 🇮🇹 | 880,259,000 |
| Switzerland | 🇨🇭 | 866,156,000 |
| Spain | 🇪🇸 | 701,586,000 |
| Czechia | 🇨🇿 | 615,516,001 |
| United Kingdom | 🇬🇧 | 606,346,000 |
| Malaysia | 🇲🇾 | 531,969,000 |
| South Korea | 🇰🇷 | 523,720,000 |
| Hungary | 🇭🇺 | 449,431,001 |
| Russia | 🇷🇺 | 442,416,998 |
| Türkiye | 🇹🇷 | 438,766,000 |
| China | 🇨🇳 | 382,692,001 |
The 6 biggest exporters of soft drinks are Austria, Germany, Netherlands, Switzerland, Thailand, and the United States of America1. These countries together made up almost half (48%) of international sales of soft drinks in 20221.
Key Takeaways
- The global soft drinks market size was valued at USD 413.46 billion in 2021, projected to reach USD 621.66 billion by 2030 with a CAGR of 5.23%2.
- Austria, Germany, Netherlands, Switzerland, Thailand, and the United States are the 6 largest soft drink exporters, accounting for 48% of global exports in 20221.
- The global trend is shifting towards non-carbonated soft drinks, as consumers seek healthier alternatives2.
- Coca-Cola and PepsiCo continue to dominate the global soft drink market, with market shares of 48% and 20.5% respectively in 20212.
- The soft drink industry is seeing a rise in unique flavor offerings and sustainability initiatives to address environmental concerns2.
Global Soft Drink Industry Overview
Soft Drinks Exports by Country (2022)
Source: FAO, 2022
.
The global soft drinks industry is always changing, offering many types of drinks to people all over the world3. It was worth $413.46 billion in 2021 and could be worth $621.66 billion by 2030, growing 5.23% each year4. Drinks like soda made up 55% of the market in 2019, while juices and teas made up 45%3.
Market Size and Growth
The soft drinks market has been growing steadily3. From 2015 to 2020, it grew 4.86% a year, reaching $680.19 billion3. It’s expected to keep growing, with a 4.51% CAGR until 2025, possibly hitting $876.43 billion3.
Major Regions and Consumption Trends
North America, Europe, and Northeast Asia were the biggest markets in 2019, making up 40%, 20%, and 14% of the industry3. South and Central America, Asia Pacific, Africa, the Middle East, and CIS countries made up the rest3. People are now choosing healthier drinks, making soft drinks more of a treat5. To meet this change, companies are making drinks with less sugar and new flavors3.
“The growth of the premium soft drinks segment has been driven by increased demand for low and no sugar variants, craft RTD beverages, functional drinks, and flavored waters.”3
Companies are also making drinks with extra health benefits, like probiotics and antioxidants3. Flavored bottled water, like energy and sports waters, is also growing in popularity3.
Leading Soft Drink Exporting Countries
A few countries have become big players in the soft drink market, showing they’re great at making and selling these drinks6. Austria is one of them, sending out 13.9% of the world’s soft drinks and making $2.7 billion in 20176. This makes Austria a key player in the global market, with a big trade surplus that shows it’s very competitive6.
Other countries like Germany, the Netherlands, and Switzerland are also big names in soft drink exports6. Germany sent out $1.81 billion worth of soft drinks in 2017, which is 9.1% of the world’s total6. The Netherlands was close behind with $1.7 billion, or 8.6% of the exports6. Switzerland also played a big role, with $1.84 billion in sales, making up 9.3% of the market6.
These countries are good at meeting the world’s growing demand for soft drinks6. They use their strong production, distribution, and brand names to sell more drinks abroad6. As the soft drink market changes, these countries will keep leading the way.
| Country | Soft Drink Exports ($ Billion) | Share of Global Exports (%) |
|---|---|---|
| Austria | $2.7 | 13.9% |
| Germany | $1.81 | 9.1% |
| Netherlands | $1.7 | 8.6% |
| Switzerland | $1.84 | 9.3% |
These countries show how tough the competition is in the soft drink industry6. As tastes and markets change, these leaders will have to keep coming up with new ideas to stay ahead.
Soft Drink Export Powerhouses
The global soft drink industry is changing fast. Thailand and the United States are now big players in the world of soft drink exports.
Thailand’s Rising Export Presence
Thailand’s soft drink exports have grown a lot, reaching $1.3 billion in 2017. This made up 6.6% of all soft drink exports worldwide7. Thailand is now a key exporter thanks to its strong manufacturing and the growing demand for its drinks.
United States’ Export Strengths and Challenges
In the United States, soft drink exports were worth $1.2 billion in 2017, making up 6.3% of global exports7. But, the US also has a big trade deficit in soft drinks7. This shows the US has challenges but also chances to meet the big demand from American consumers.
“The global soft drinks market was valued at $413 billion in 2021 and is projected to surpass $620 billion by 2030, with a Compound Annual Growth Rate (CAGR) of 5.23%.”8
Thailand and the United States are leading in soft drink exports, each with their own strengths and challenges. They have made their mark in the global market, shaping the future of the soft drink industry.
The Largest Soft Drink Exporters in the World
Top 15 Exporting Countries by Value
The global soft drinks market is always changing, with many countries trying to sell more drinks abroad. In 2022, Austria led with $3.5 billion in exports, making up 13.3% of the world’s total9. Germany, the Netherlands, and Switzerland followed, each making a significant impact9.
Thailand, the United States, Mexico, Belgium, France, and Poland also made the top 10 list9. Italy, South Korea, the United Kingdom, Spain, and Denmark rounded out the top 159.
Year-over-Year Growth and Declines
Some countries saw big increases in their soft drink exports from 2021 to 2022. Poland, Mexico, Austria, and Denmark all grew significantly9. On the other hand, the Netherlands, Switzerland, Italy, the United Kingdom, and the United States saw their exports drop9.

The soft drink market is always changing, with new countries trying to make a mark.
Trade Surpluses and Deficits
In the global soft drink industry, countries show different levels of trade surpluses and deficits. The countries with the highest positive net exports, or trade surpluses, for soft drinks in 2022 were Austria ($2.8 billion, up 25.3%), Thailand ($1.5 billion, up 4.6%), Switzerland ($1.4 billion, down -8.2%), the Netherlands ($1.3 billion, up 12.6%), and Mexico ($823.5 million, up 176.2%).10 On the other hand, the countries with the largest negative net exports, or trade deficits, for soft drinks in 2022 were the United States (-$2.3 billion, up 7.4%), the United Kingdom (-$1.3 billion, up 117.9%), Canada (-$578.2 million, down -5.7%), Vietnam (-$498.2 million, up 2591.4%), and mainland China (-$490.9 million, up 38.1%)10.
Countries with Highest Positive Net Exports
The top countries with the highest positive net exports in the soft drink industry are leading exporters. Austria, with a trade surplus of $2.8 billion, has firmly positioned itself as a global powerhouse in soft drink exports, experiencing a 25.3% increase in 2022.10 Thailand and Switzerland also stand out, with trade surpluses of $1.5 billion and $1.4 billion, respectively, although Switzerland saw a decline of 8.2.10 The Netherlands and Mexico have also emerged as significant players, with trade surpluses of $1.3 billion and $823.5 million, recording growth of 12.6% and 176.2%, respectively.10
Countries with Highest Negative Net Exports
On the other hand, several countries face substantial trade deficits in the soft drink industry. The United States, with a trade deficit of $2.3 billion, has struggled to keep up with its global counterparts, experiencing a 7.4% increase in its deficit.10 The United Kingdom and Canada also face significant deficits, at $1.3 billion and $578.2 million, respectively, with the UK’s deficit rising by 117.9% and Canada’s declining by 5.7%.10 Vietnam and mainland China have also emerged as countries with substantial trade deficits, at $498.2 million and $490.9 million, respectively, with Vietnam’s deficit skyrocketing by 2591.4% and China’s increasing by 38.1%.10
“The global soft drink industry is a complex landscape of trade surpluses and deficits, with some countries emerging as clear exporters and others struggling to keep up with the competition.”
Major Soft Drink Exporting Companies
The global soft drink industry is led by a few big names in the export market11. Companies like Asahi Soft Drinks from Japan, Britvic plc from the United Kingdom, Cott from Canada, and Dr Pepper Snapple Group from the United States are at the forefront12. Together, they make up a big part of the global soft drink exports, showing how concentrated the industry is11.
The value of the global soft drinks market was US$127,550 million in 2023 and is set to hit US$170,700 million by 203013. This growth is expected to continue at a 4.2% annual rate from 2024 to 203113. Asia-Pacific leads with about 33% of the market, while Latin America makes up around 19%13. The top 3 companies in the industry control about 35% of the market13.
Other big names in soft drink exports include Drinko from Lebanon, Faygo Beverages, Inc. from the United States, and Fraser and Neave, Limited from Singapore12. These companies are key players in the global soft drink trade. They use their global presence and brand strength to grow their exports12.
| Company | Headquarters | Key Brands |
|---|---|---|
| Asahi Soft Drinks | Japan | Mitsuya Cider, Wilkinson, Wonda |
| Britvic plc | United Kingdom | Robinsons, Tango, J2O |
| Cott | Canada | Cott Beverages, RC Cola, Vintage |
| Dr Pepper Snapple Group | United States | Dr Pepper, Snapple, 7 Up |
| Drinko | Lebanon | Drinko, Kinley, Aqua Drinko |
| Faygo Beverages, Inc. | United States | Faygo, Fangz, Ohana |
| Fraser and Neave, Limited | Singapore | F&N, 100 Plus, Seasons |
These major companies are vital in the global soft drink trade. They use their brand power, distribution networks, and production skills to meet the world’s growing demand for soft drinks12.

Emerging Trends and Flavors
The soft drink industry is changing fast. People are moving away from sugary drinks to ones that are non-carbonated and have unique flavors14. Bottled water is now the top-growing drink type14. Also, drinks with less sugar are becoming popular, including carbonated sodas and juices14.
Health-conscious consumers are driving new trends in soft drinks. They like drinks with plant-based, immune health, prebiotic, and high fiber claims14. Fruit flavors are still big, but people are looking for more variety14.
Rise of Non-Carbonated and Unique Flavor Offerings
Drink makers are now offering more non-carbonated and unique flavors14. They’re using sweeteners like sucralose and acesulfame-K more often14. This is because consumers want new tastes15. You might see more berries, exotic fruits, and spices in drinks soon14.
Soft drink companies plan to bring out more flavored bottled water and iced tea1415. They see a big growth in the non-carbonated soft drink market1415.
“The soft drink industry is evolving to meet the changing preferences of health-conscious consumers who are seeking out more diverse and innovative flavors.”
Sustainability and Health Concerns
The soft drink industry is under a lot of pressure to tackle sustainability and health issues. Companies are working hard to lessen their environmental impact with new projects. At the same time, people want healthier drink options16.
Industry Efforts to Address Environmental Impact
Beverage companies are taking steps to lower their carbon footprint. In 2021, the industry released 1.5 billion tonnes of CO2e, which was 3.8% of all emissions16. But, the rate of cutting carbon is too slow, not meeting goals for 2030 or 205016. To meet targets, the industry needs to cut emissions from 1.5 billion to 1.2 billion by 2030, and then down to 0.2 billion by 205016.
Companies are also looking at how to make their packaging less harmful to the environment. For example, making wine bottles lighter from 550g to under 420g by 2026 will save 23,000 tonnes of CO2e16. Also, different packaging types have different effects on the environment, with PET being the least harmful16.
Consumer Shift Towards Healthier Options
People are moving away from sugary drinks towards healthier and greener choices17. A UK survey showed that only 7% of consumers bought sustainable soft drinks recently, which is less than other eco-friendly items16.
To meet this new demand, soft drink companies are coming up with new flavors and non-carbonated drinks17. This change in what people want is pushing the industry to focus more on being sustainable and healthy, keeping up with market trends17.
“The reduction of glass bottle weight from 550g to less than 420g by 2026 in wine production will result in saving 23,000tCO2e.”
Regional Dynamics and Competitive Landscape
The global soft drink market is shaped by regional trends and intense competition18. North America, Europe, and Northeast Asia lead in consumption. But, Asia and Latin America are growing fast18. Big names like Coca-Cola and PepsiCo are fighting for more market share18. Yet, smaller brands are making their mark, showing the market’s diversity19.
In 2023, the Soft Drinks Market was worth USD XX.X Billion18. It’s expected to hit USD XX.X Billion by 2031, growing at a CAGR of XX.X% from 2024 to 203118. The Asia-Pacific region leads with about 33% market share19. Latin America follows with around 19%19. Growth comes from government support, industrial growth, and more consumer demand in these areas18.
In developed regions, big players dominate the soft drink market18. The top 3 companies, Coca-Cola, PepsiCo, and Nestle, control about 35% of the market19. But, new and healthier options are gaining popularity as consumers look for variety and sustainability19.
| Key Factors | North America | Europe | Asia-Pacific | Latin America |
|---|---|---|---|---|
| Market Share | High | High | Largest (33%) | Significant (19%) |
| Consumption Trends | Established, Mature | Established, Mature | Rapid Growth | Rapid Growth |
| Key Players | Coca-Cola, PepsiCo | Coca-Cola, PepsiCo, Nestlé | Local/Regional Brands | Local/Regional Brands |
| Competitive Landscape | Intense Competition | Intense Competition | Emerging Competition | Emerging Competition |
The soft drink market is changing fast, with regional differences and tough competition18. As what consumers want changes, the industry must keep up with new trends19. It also needs to handle the challenges of global markets1819.
Conclusion
The global soft drink industry is always changing. It’s influenced by what consumers want, worries about the environment, and tough competition20. Big names like Coca-Cola and PepsiCo stay on top21. But new markets and unique flavors bring chances for growth in the future of soft drink market20. How well it can change to meet new needs will guide its future.
Soft drinks are a big deal in the beverage world, making $742,235 million in 2021 and growing by 5.41% each year (2021-2025)20. The US was the biggest market for soft drinks in 2021, making $230,468 million, with each person spending about $98.42 on them20. But, the top two companies, Coca-Cola Co and PepsiCo, have a lot of power and spend a lot on things that might not be good for us21.
As the soft drink industry changes, it’s key to keep up with what consumers like, tackle environmental issues, and stay competitive2021. Being able to innovate and adjust will help decide the global soft drink industry outlook and the future of soft drink market2021. How it does this will affect its success and its role in the world of beverages.
FAQ
What are the largest soft drink exporters in the world?
The top 15 soft drink exporting countries by value in 2022 were: Austria, Germany, Netherlands, Switzerland, Thailand, United States, Mexico, Belgium, France, Poland, Italy, South Korea, United Kingdom, Spain, and Denmark.
What is the global value of soft drinks exported?
The global value of soft drinks shipped rose by an average 22.2% for all exporting countries. This was compared to 5 years earlier in 2018 when soft drinks sold internationally were valued at .8 billion. In 2022, international sales of exported soft drinks hit US.7 billion.
What is the global soft drink market size and growth outlook?
The global soft drinks market size was valued at USD 413.46 billion in 2021. It is expected to reach USD 621.66 billion by 2030 at a CAGR of 5.23%.
What are the major regions for soft drink consumption?
In 2019, North America, Europe, and Northeast Asia had the biggest shares in the soft drink market. North America led with a 40% share, followed by Europe at 20%, and Northeast Asia at 14%.
What are the emerging trends in the soft drink industry?
Consumers are moving away from sugary, carbonated drinks towards non-carbonated and unique flavors. In response, soft drink companies are creating drinks with less sugar and more innovative tastes.
How are soft drink companies addressing sustainability and health concerns?
Companies are cutting down their environmental impact through recycling and sustainable ingredients. They’re also offering healthier options to meet consumer demands for non-carbonated and low-calorie drinks.
What are the competitive dynamics in the global soft drink market?
The global soft drink market is shaped by regional differences and fierce competition. While North America, Europe, and Northeast Asia lead in consumption, Asia and Latin America are growing fast. Big names like Coca-Cola and PepsiCo are fighting for market share. At the same time, smaller brands are finding their places in the market.
Source Links
- What countries are the top exporters of soft drinks? – Answers – https://www.mapsofworld.com/answers/economics/countries-top-exporters-soft-drinks/
- 16 Largest Soda and Soft Drink Companies in The World – https://finance.yahoo.com/news/16-largest-soda-soft-drink-141215527.html
- Global Soft Drinks Industry Size, Trends, and Challenges – https://www.wm-strategy.com/news/soft-drinks-industry-trends-and-size
- Soft Drinks Market Size & Share Report, 2028 – https://www.grandviewresearch.com/industry-analysis/soft-drinks-market-report
- World Market for Soft Drinks – https://www.euromonitor.com/world-market-for-soft-drinks/report
- 2032, Soft Drink Market Size | Top Countries Data with In-Depth Research – https://www.linkedin.com/pulse/2032-soft-drink-market-size-top-countries-data-wk4fc
- How Coca-Cola Makes Money – https://www.investopedia.com/articles/markets/112515/how-does-cocacola-actually-make-money.asp
- 15 Countries where Pepsi or Coca-Cola is Not Sold – https://finance.yahoo.com/news/15-countries-where-pepsi-coca-111455534.html
- List of soft drink producers – https://en.wikipedia.org/wiki/List_of_soft_drink_producers
- USDA ERS – The U.S. Trade Balance. . . More Than Just A Number – https://www.ers.usda.gov/amber-waves/2004/february/the-u-s-trade-balance-more-than-just-a-number/
- Global Soft Drink & Bottled Water Manufacturing – Market Size, Industry Analysis, Trends and Forecasts (2024-2029)| IBISWorld – https://www.ibisworld.com/global/market-research-reports/global-soft-drink-bottled-water-manufacturing-industry/
- Top Soft Drinks Exporters by Country 2022 – https://www.worldstopexports.com/top-soft-drinks-exporters-by-country/
- 2031 “Soft Drinks Market Size” | Top Companies & No. of figure 107 – https://www.linkedin.com/pulse/2031-soft-drinks-market-size-top-companies-figure-yo6cc
- Soft Drinks Trends. Key consumption trends for soft drinks such as – https://www.innovamarketinsights.com/trends/soft-drinks-trends/
- Soft Drinks Market Size, Projections of Share, Trends, and Growth for 2023-2030 – https://www.linkedin.com/pulse/soft-drinks-market-size-projections-share-trends
- Why the sustainability spotlight may start to shine brighter on drinks – https://www.just-drinks.com/features/why-the-sustainability-spotlight-may-start-to-shine-brighter-on-drinks/
- Our Priority Sustainability Issues | The Coca-Cola Company – https://www.coca-colacompany.com/sustainability/our-priority-sustainability-issues
- Soft Drinks Market Competitive Landscape: Leading Players and Strategies – https://www.linkedin.com/pulse/soft-drinks-market-competitive-landscape-leading-axzcf
- Soft Drinks Market Size and Share: Analysis of Current and Future Growth | 2024-2032 – https://www.linkedin.com/pulse/soft-drinks-market-size-share-analysis-current-v6hpf
- Why is the soft drink industry so profitable? An analysis – Tan Do – https://tandobeverage.com/why-is-the-soft-drink-industry-so-profitable/
- Maximising the wealth of few at the expense of the health of many: a public health analysis of market power and corporate wealth and income distribution in the global soft drink market – Globalization and Health – https://globalizationandhealth.biomedcentral.com/articles/10.1186/s12992-021-00781-6