Did you know Singapore is expected to be the wealthiest nation in Asia by 2025? It will have a GDP per capita of 89,354 Int$. This shows its strong economy and a trend in Asia where economic power is shifting.
We will look at the top 20 Asian countries by GDP (PPP) per capita. We’ll see what makes their economies strong and how they rank for 2025.
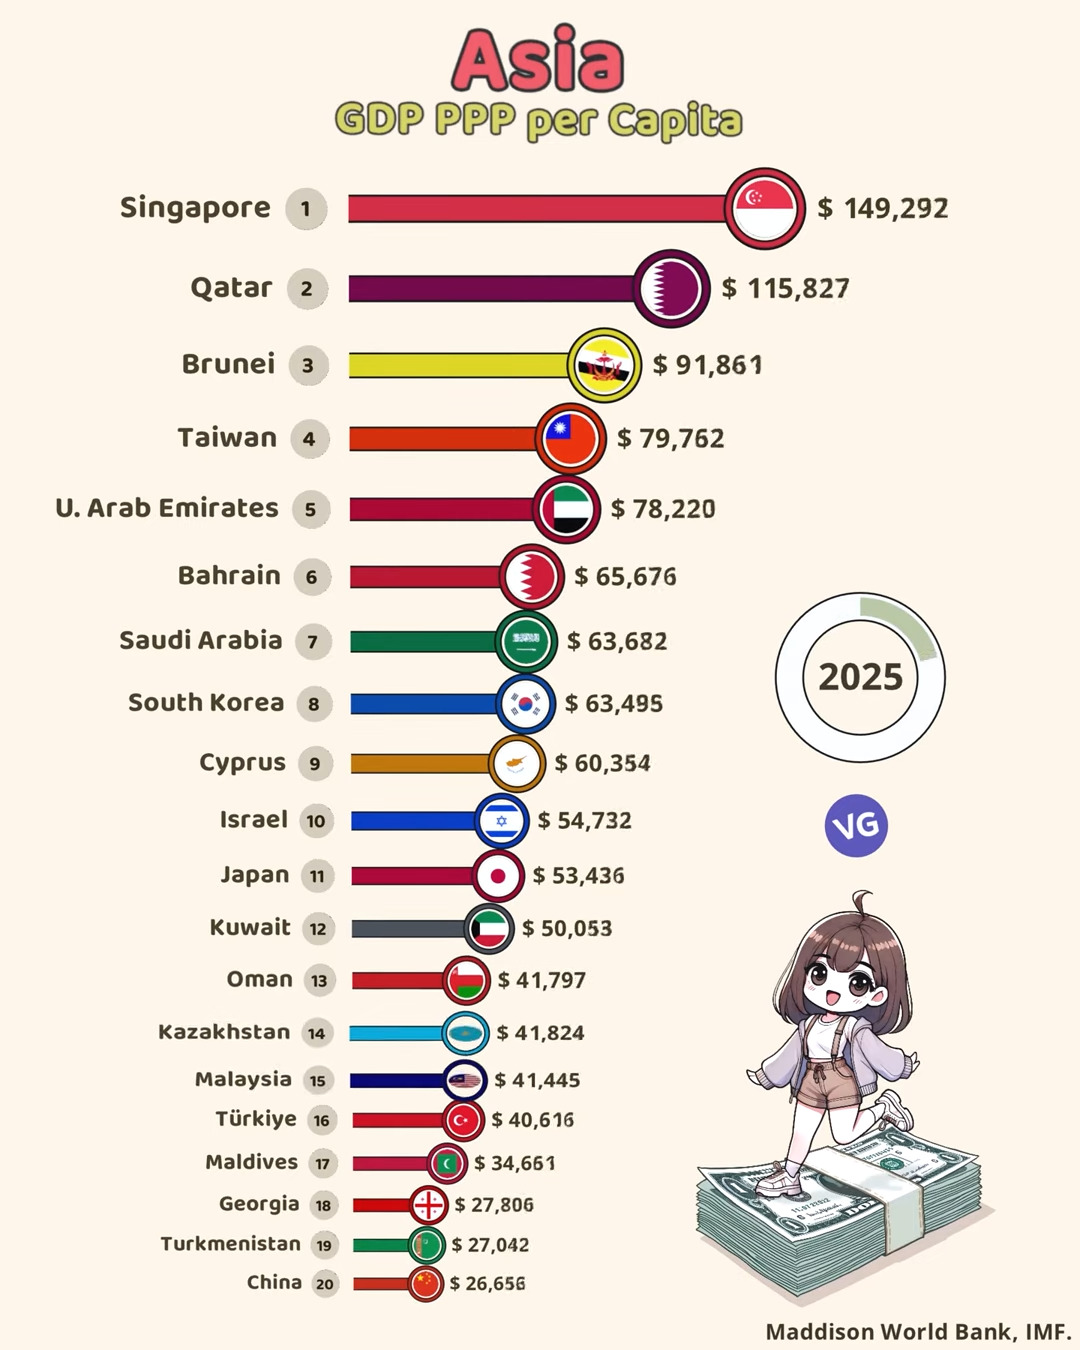
Top 20 Asian Countries by GDP (PPP) per Capita (2025)
| Rank | Country | GDP (PPP) per Capita ($) |
|---|---|---|
| 1 | 🇸🇬 Singapore | $149,292 |
| 2 | 🇶🇦 Qatar | $115,827 |
| 3 | 🇧🇳 Brunei | $91,861 |
| 4 | 🇹🇼 Taiwan | $79,762 |
| 5 | 🇦🇪 UAE | $78,220 |
| 6 | 🇧🇭 Bahrain | $65,676 |
| 7 | 🇸🇦 Saudi Arabia | $63,682 |
| 8 | 🇰🇷 South Korea | $63,495 |
| 9 | 🇨🇾 Cyprus | $60,354 |
| 10 | 🇮🇱 Israel | $54,732 |
| 11 | 🇯🇵 Japan | $53,436 |
| 12 | 🇰🇼 Kuwait | $50,053 |
| 13 | 🇴🇲 Oman | $41,797 |
| 14 | 🇰🇿 Kazakhstan | $41,824 |
| 15 | 🇲🇾 Malaysia | $41,445 |
| 16 | 🇹🇷 Türkiye | $40,616 |
| 17 | 🇲🇻 Maldives | $34,661 |
| 18 | 🇬🇪 Georgia | $27,806 |
| 19 | 🇹🇲 Turkmenistan | $27,042 |
| 20 | 🇨🇳 China | $26,656 |
The International Monetary Fund predicts big GDP numbers for countries like Qatar and the United Arab Emirates. They expect Qatar to have 81,968 Int$ and the UAE 88,221 Int$. But it’s not just the old leaders that are doing well. Countries like Vietnam and India are growing fast, aiming to change the Asian economic scene.
Understanding GDP (PPP) and Its Importance
Understanding GDP (PPP) is key to seeing how different countries do economically. Gross Domestic Product (GDP) shows a country’s total economic output. But, the GDP (PPP) definition looks at purchasing power parity. This makes comparing living standards between countries more accurate.
Definition of GDP (PPP)
GDP (PPP) is the GDP adjusted for purchasing power parity. It shows how much money can buy in different countries. This helps us see how much people can afford in their own countries. The GDP (PPP) definition is vital for a true view of national economies.
Why GDP (PPP) Matters for Economies
GDP (PPP) is very important. It helps avoid biases found in nominal GDP, which can be skewed by price differences. It shows how well a country can meet its people’s needs and wants. This helps policymakers and economists make better decisions for the economy.
Comparative Analysis: GDP vs. GDP (PPP)
Comparing GDP and GDP (PPP) shows big differences in how we see economic health. GDP gives a nominal figure of economic output. But, GDP (PPP) gives a more detailed view. For example, some countries might have high nominal GDP but low GDP (PPP).
This is very important for emerging markets. They have different costs of living. Looking at GDP (PPP) helps us understand economic differences better.
| Country | GDP (PPP) per Capita |
|---|---|
| Singapore | $129,552 |
| Kuwait | $43,260 |
| Japan | $46,231 |
| China | $23,131 |
| India | $9,661 |
| Afghanistan | $2,007 |
Top 20 Asian Countries by GDP (PPP) per Capita (2025)
The global economy is changing fast. Looking at the top countries by GDP in Asia for 2025 gives us clues about their future. We’ll explore how these countries are doing based on their GDP (PPP) per capita. We’ll also look at what factors are helping them grow.
Overview of the Top Countries
The top countries in Asia for 2025 show a wide range of economic styles. China and India are leading with big GDP per capita numbers. Japan, South Korea, and Singapore are also strong. Looking back at their past helps us see why they’re leaders in Asia’s economy.
Economic Factors Influencing Rankings
Many things affect a country’s GDP ranking in Asia. Investing in tech and education boosts innovation and productivity. These are key for higher GDP per capita. Labor, infrastructure, and trade also play big roles in a country’s economy. Knowing these factors helps us understand why some countries are doing better than others.
Predictions for 2025 Growth
Looking ahead to 2025, some countries are expected to grow fast. Vietnam and India are among them. India’s IT sector and growing middle class could push its growth rate to near 7%. Vietnam is also growing, thanks to foreign investment and industrialization. These predictions show the Asian market is changing, with new chances for growth.
Regional Comparisons and Future Trends
Asia’s economy is diverse, with different growth rates and challenges. Southeast Asia, like Indonesia and the Philippines, is becoming more important. Trends like more trade within the region and tech progress could change GDP rankings. By 2025, Asia’s economy is expected to be more connected and competitive.
| Country | Projected GDP (PPP) per Capita (2025) | Current Economic Growth Rate |
|---|---|---|
| China | USD 25,000 | 5.5% |
| India | USD 10,500 | 6.8% |
| Japan | USD 42,000 | 0.2% |
| South Korea | USD 36,000 | 3.0% |
| Singapore | USD 65,000 | 3.5% |
Conclusion
The summary of GDP (PPP) in Asia 2025 gives us key insights into the region’s economy. ASEAN’s GDP (PPP) is expected to hit around $13.022 trillion. This shows how important this bloc is becoming economically.
A per capita GDP of $19,028 also shows the different economic levels in member states. This affects how businesses and policymakers plan for growth.
Looking at GDP rankings helps guide future investments and economic plans. Countries like China, with its large GDP, set the standard for others. They show the importance of adapting and innovating in a global market.
Tracking GDP trends is crucial. It helps predict the economy and guides strategic decisions for governments and industries. As Asia’s economy changes, keeping an eye on these trends is essential. It helps everyone stay on top of the challenges and chances ahead.
FAQ
What does GDP (PPP) stand for?
GDP (PPP) stands for Gross Domestic Product adjusted for Purchasing Power Parity. It shows a country’s economic strength by considering price differences.
Why is GDP (PPP) important for comparing economies?
GDP (PPP) is key for comparing economies. It helps understand living standards and economic power across nations. This way, we can fairly compare costs of living.
Which country is projected to have the highest GDP per capita (PPP) in Asia for 2025?
Singapore is expected to lead Asia in 2025 with a GDP per capita of 89,354 Int$.
How does Malaysia’s economic trajectory compare to its neighbors?
Malaysia’s economy is diverse and keeps a steady GDP per capita. It aims to boost productivity and technology to climb the rankings.
What are the fast-growing economies in Asia according to the predictions for 2025?
Vietnam and India are set to grow fast by 2025. Their GDP figures and economic development are expected to soar.
How does GDP (PPP) compare to nominal GDP?
GDP (PPP) is better than nominal GDP for understanding economic health. It adjusts for price differences, showing real living standards and purchasing power.
What factors influence GDP (PPP) rankings among countries?
GDP (PPP) rankings are shaped by investment in technology, education quality, labor productivity, and economic policies.
How do regional comparisons affect the understanding of GDP (PPP) in Asia?
Regional comparisons highlight economic trends and shifts in Asia. They show why GDP (PPP) rankings vary, crucial for policymakers and businesses.
Source Links
- List of Asian countries by GDP (PPP) per capita
- The Top 25 Economies in the World
- The World in 2050
- GDP Per Capita PPP | Data By Indicator | 2025 | Data
- Richest Countries in the World 2024 – Global Finance Magazine
- Top 10 Richest Countries In The World By GDP Per Capita In 2025 – Forbes India
- The Top 10 Largest Economies in the World in 2025
- Asia on the cusp of a new era
- Modeling and Forecasting Infant Mortality Rates of Asian Countries in The Perspective of GDP(PPP)
- ASEAN
- Unpacking China’s GDP | ChinaPower Project