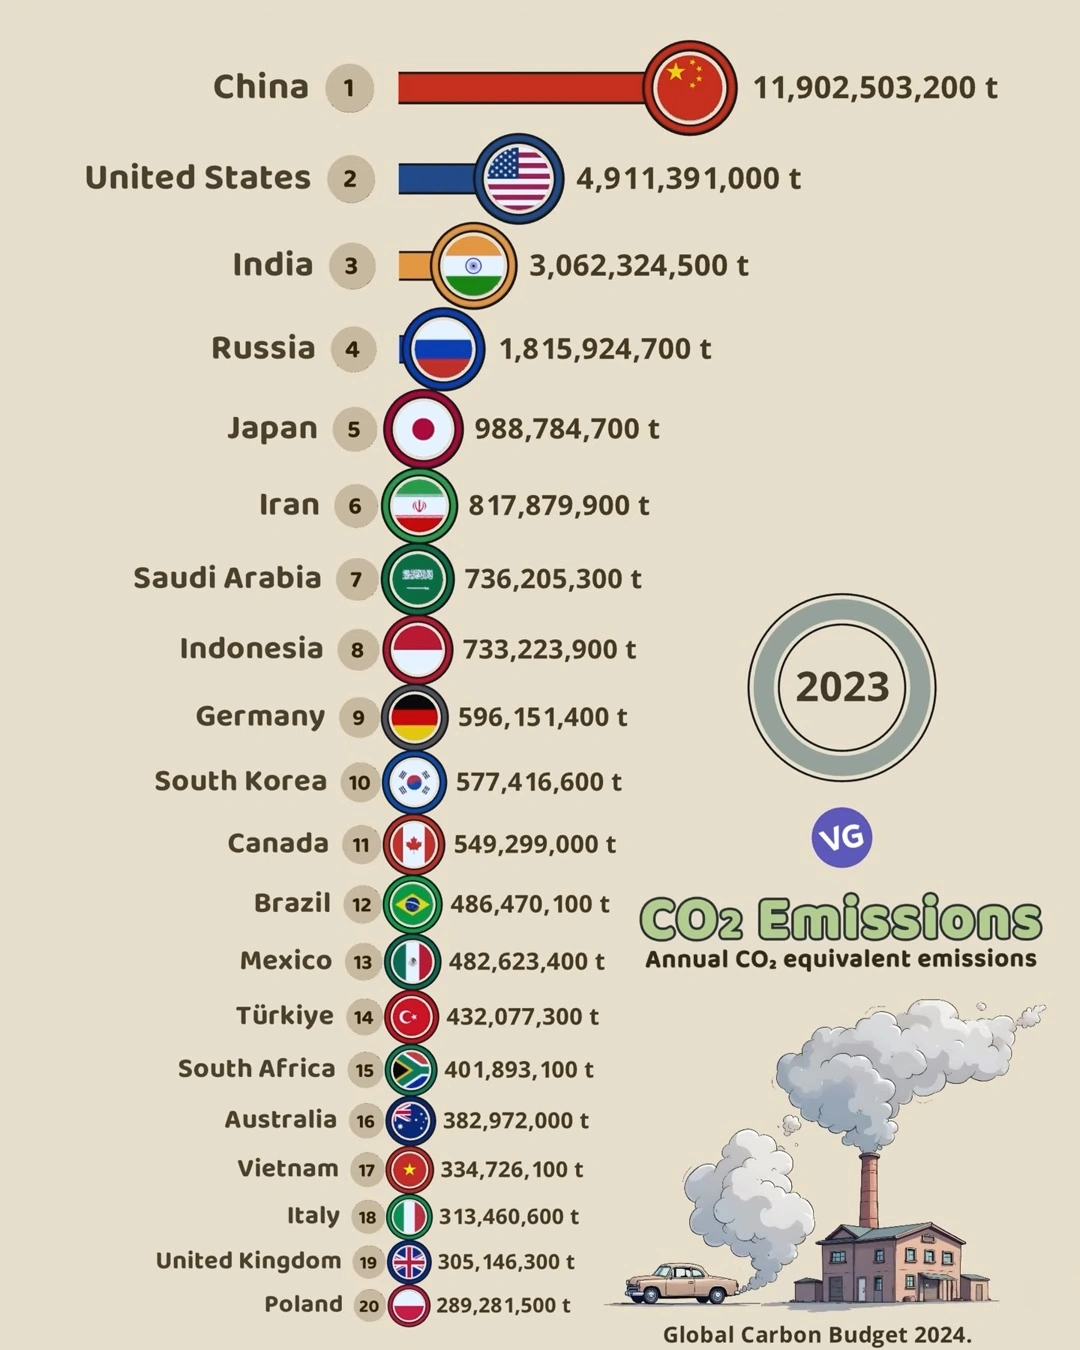
Climate change remains one of humanity’s most pressing challenges, with carbon dioxide emissions serving as a primary driver of global warming. According to 2023 data from the Global Carbon Budget, the distribution of CO2 emissions reveals significant disparities among nations, with implications for international climate policy and future mitigation efforts.
Top CO₂ Emitting Countries (2023) 🔥🌍
| Rank | Country | CO₂ Emissions (tons) |
|---|---|---|
| 1 🇨🇳 | China | 11,902,503,200 t |
| 2 🇺🇸 | United States | 4,911,391,000 t |
| 3 🇮🇳 | India | 3,062,324,500 t |
| 4 🇷🇺 | Russia | 1,815,924,700 t |
| 5 🇯🇵 | Japan | 988,784,700 t |
| 6 🇮🇷 | Iran | 817,879,900 t |
| 7 🇸🇦 | Saudi Arabia | 736,205,300 t |
| 8 🇮🇩 | Indonesia | 733,223,900 t |
| 9 🇩🇪 | Germany | 596,151,400 t |
| 10 🇰🇷 | South Korea | 577,416,600 t |
| 11 🇨🇦 | Canada | 549,299,000 t |
| 12 🇧🇷 | Brazil | 486,470,100 t |
| 13 🇲🇽 | Mexico | 482,623,400 t |
| 14 🇹🇷 | Türkiye | 432,077,300 t |
| 15 🇿🇦 | South Africa | 401,893,100 t |
| 16 🇦🇺 | Australia | 382,972,000 t |
| 17 🇻🇳 | Vietnam | 334,726,100 t |
| 18 🇮🇹 | Italy | 313,460,600 t |
| 19 🇬🇧 | United Kingdom | 305,146,300 t |
| 20 🇵🇱 | Poland | 289,281,500 t |
The Major Emitters: A Continuing Pattern of Concentration
The 2023 data shows that global carbon emissions remain heavily concentrated among a small number of countries. China continues to lead with a staggering 11.9 billion tonnes of CO2 equivalent emissions, representing approximately 27% of global emissions based on most recent global totals. This figure is more than double the emissions of the United States (4.9 billion tonnes), which holds the second position.
Together, the top three emitters—China, the United States, and India (3.1 billion tonnes)—account for nearly 20 billion tonnes of CO2 emissions, highlighting the critical importance of these nations in any effective global climate strategy.
Regional Distribution and Economic Development
The data reveals distinct patterns across different regions:
Asia’s Dominant Role
Asian nations feature prominently, with China, India, Japan (988.8 million tonnes), Iran (817.9 million tonnes), Saudi Arabia (736.2 million tonnes), Indonesia (733.2 million tonnes), and South Korea (577.4 million tonnes) all ranking in the top ten. This concentration reflects Asia’s industrial growth, large populations, and energy-intensive development paths.
North American Footprint
The United States remains the second-largest emitter globally, while Canada (549.3 million tonnes) and Mexico (482.6 million tonnes) also appear among the top 15, demonstrating North America’s significant carbon footprint despite advanced economies and technological capabilities.
European Representation
European nations appear with more moderate emissions levels, with Germany (596.2 million tonnes) leading the continent’s emissions, followed by Italy (313.5 million tonnes), the United Kingdom (305.1 million tonnes), and Poland (289.3 million tonnes). This reflects both the region’s earlier industrialization and more recent climate policies.
Emerging Economies and Their Carbon Trajectory
Several rapidly developing economies feature prominently in the emissions rankings:
- India’s third-place position with 3.1 billion tonnes reflects its ongoing industrialization and population growth
- Brazil (486.5 million tonnes) and Mexico (482.6 million tonnes) represent large Latin American economies with significant emissions
- South Africa (401.9 million tonnes) and Vietnam (334.7 million tonnes) demonstrate how emerging economies often follow carbon-intensive development paths
Per Capita vs. Total Emissions: The Hidden Story
While total emissions data is crucial, it’s important to recognize that per capita emissions tell a different story. Many of the largest total emitters have vast populations, meaning their per capita emissions may be lower than smaller nations with energy-intensive economies or lifestyles.
For instance, while China leads in total emissions, on a per capita basis, several nations including the United States, Canada, Saudi Arabia, and Australia typically have higher emissions per person. This distinction is vital when considering equitable approaches to emissions reduction.
Implications for Climate Policy
The 2023 emissions data has several important implications:
- Concentrated responsibility: The outsized impact of the top emitters means their climate policies have disproportionate global importance
- Development challenges: Many high-emitting nations are still developing economically, creating tension between growth goals and emissions reduction
- Industry and energy transitions: The high emissions from industrial powers highlight the need for clean energy transitions and industrial decarbonization
- Differentiated approaches: The varying circumstances of emitters suggest that climate solutions must be tailored to national contexts
As global temperatures continue to rise, this emissions data serves as a critical backdrop for international climate negotiations and national policy development. Meeting global climate goals will require significant emissions reductions from these top emitters, alongside contributions from all nations.
Source: Global Carbon Budget 2024, as indicated in the image