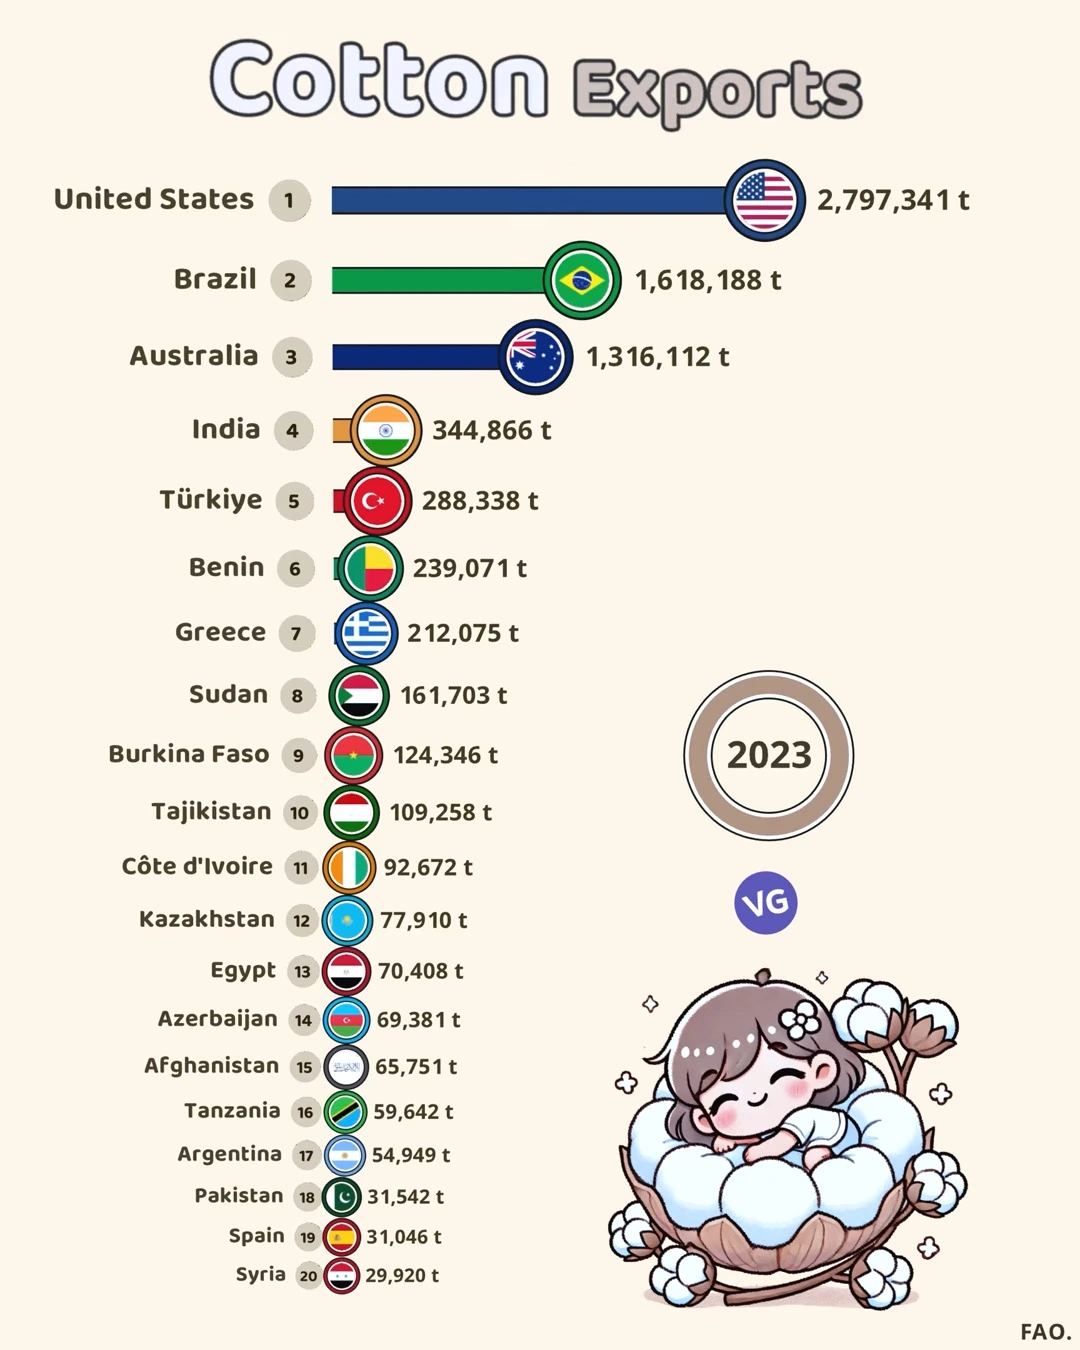
Looking at the FAO data for 2023, the global cotton export market shows distinct tiers of producers, with significant variations in export volumes and interesting regional patterns.
Top Cotton Exporting Countries (2023)
| Rank | Country & Flag | Cotton Exports (t) |
|---|---|---|
| 1 | 🇺🇸 United States | 2,797,341 t |
| 2 | 🇧🇷 Brazil | 1,618,188 t |
| 3 | 🇦🇺 Australia | 1,316,112 t |
| 4 | 🇮🇳 India | 344,866 t |
| 5 | 🇹🇷 Türkiye | 288,338 t |
| 6 | 🇧🇯 Benin | 239,071 t |
| 7 | 🇬🇷 Greece | 212,075 t |
| 8 | 🇸🇩 Sudan | 161,703 t |
| 9 | 🇧🇫 Burkina Faso | 124,346 t |
| 10 | 🇹🇯 Tajikistan | 109,258 t |
| 11 | 🇨🇮 Côte d’Ivoire | 92,672 t |
| 12 | 🇰🇿 Kazakhstan | 77,910 t |
| 13 | 🇪🇬 Egypt | 70,408 t |
| 14 | 🇦🇿 Azerbaijan | 69,381 t |
| 15 | 🇦🇫 Afghanistan | 65,751 t |
| 16 | 🇹🇿 Tanzania | 59,642 t |
| 17 | 🇦🇷 Argentina | 54,949 t |
| 18 | 🇵🇰 Pakistan | 31,542 t |
| 19 | 🇪🇸 Spain | 31,046 t |
| 20 | 🇸🇾 Syria | 29,920 t |
Top-Tier Exporters
Dominant Players
The market is clearly led by three major exporters:
- United States: 2,797,341 tonnes
- Brazil: 1,618,188 tonnes
- Australia: 1,316,112 tonnes
These three nations combined account for the majority of global cotton exports, with the United States exporting nearly twice the volume of its closest competitor.
Mid-Tier Exporters
Regional Powers
Several countries maintain significant but smaller export volumes:
- India: 344,866 tonnes
- Türkiye: 288,338 tonnes
- Benin: 239,071 tonnes
- Greece: 212,075 tonnes
African Cotton Belt
The data shows notable participation from African nations:
- Benin: 239,071 tonnes
- Sudan: 161,703 tonnes
- Burkina Faso: 124,346 tonnes
- Côte d’Ivoire: 92,672 tonnes
- Tanzania: 59,642 tonnes
Asian Producers
Asian countries show varied levels of participation:
- India leads the region with 344,866 tonnes
- Tajikistan: 109,258 tonnes
- Kazakhstan: 77,910 tonnes
- Azerbaijan: 69,381 tonnes
- Afghanistan: 65,751 tonnes
- Pakistan: 31,542 tonnes
Market Implications
The distribution of cotton exports reveals several key insights:
- Americas’ dominance through US and Brazilian production
- Australia’s strong position as a Southern Hemisphere producer
- Africa’s collective importance in the global market
- Diverse Asian participation across multiple countries
Economic Impact
This distribution has significant implications:
- Trade relationship dynamics
- Economic development opportunities for developing nations
- Agricultural infrastructure investment needs
- Employment in rural agricultural sectors
- International trade balance effects
The data demonstrates the continuing importance of cotton as a global commodity and highlights the diverse range of nations participating in its trade.