Did you know the US and Europe aren’t economically equal? A surprising fact shows that European economies grew about 1 percent, not 3 percent1. This gap has widened, with a huge 82 percent difference in GDP per capita in 20212. This article explores the economic links between US states and European countries, revealing surprising facts about their wealth.
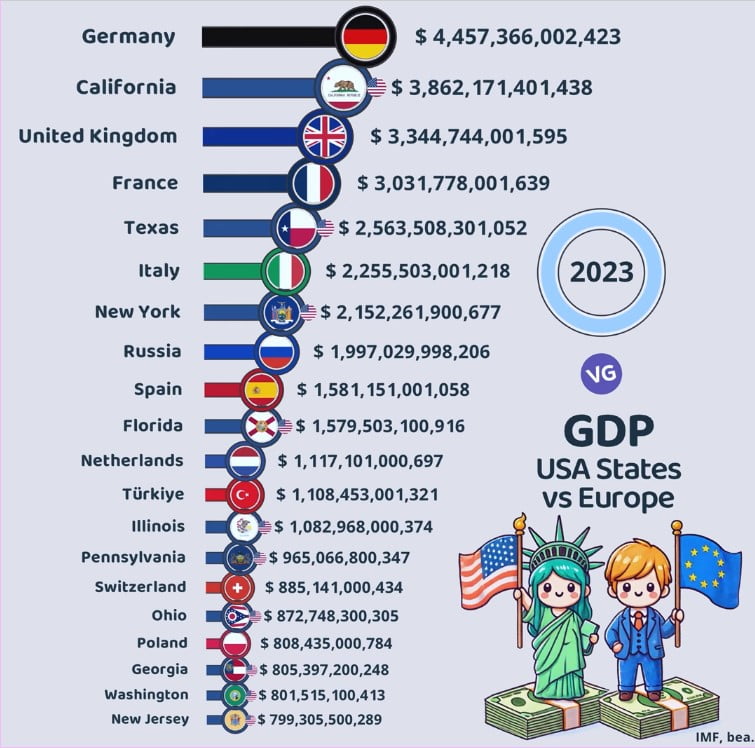
| Entity | Flag | GDP ($) |
|---|---|---|
| Germany | 🇩🇪 | 4,457,366,002,423 |
| California | 🐻 | 3,862,171,401,438 |
| United Kingdom | 🇬🇧 | 3,344,744,001,595 |
| France | 🇫🇷 | 3,031,778,001,639 |
| Texas | 🌟 | 2,563,508,301,052 |
| Italy | 🇮🇹 | 2,255,503,001,218 |
| New York | 🗽 | 2,152,261,900,677 |
| Russia | 🇷🇺 | 1,997,029,998,206 |
| Spain | 🇪🇸 | 1,581,151,001,058 |
| Florida | 🍊 | 1,579,503,100,916 |
| Netherlands | 🇳🇱 | 1,117,101,000,697 |
| Türkiye | 🇹🇷 | 1,108,453,001,321 |
| Illinois | 🌽 | 1,082,968,000,374 |
| Pennsylvania | 🔔 | 965,066,800,347 |
| Switzerland | 🇨🇭 | 885,141,000,434 |
| Ohio | 🌰 | 872,748,300,305 |
| Poland | 🇵🇱 | 808,435,000,784 |
| Georgia | 🍑 | 805,397,200,248 |
| Washington | 🌲 | 801,515,600,367 |
| New Jersey | 🌊 | 799,305,500,289 |
The US’s economy grew from $14.8 trillion in 2008 to a massive $26.9 trillion by 20233. Meanwhile, the Eurozone’s economy rose from $14.2 trillion to just over $15 trillion during the same period3. Now, the US leads the Eurozone by an astonishing 80%3. This shows Europe’s economy is falling behind the US.
Key Takeaways
- The average growth rate in mature and developed European economies has been closer to 1% than 3%.
- The economic divergence between EU member states and US states has resulted in a growing GDP per capita gap of up to 82%.
- The GDP of the US has increased from $14.8 trillion in 2008 to $26.9 trillion in 2023, while the Eurozone’s GDP grew from $14.2 trillion to just over $15 trillion during the same period.
- The GDP gap between the US and the Eurozone has widened to 80%.
- Europe’s economic decline relative to the US is becoming increasingly apparent.
Introduction to GDP Comparisons
GDP Comparison: USA States vs European Countries (2023)
Source: IMF, bea. (2023)
.
Knowing how economies grow is key for those who make policy and analyze data. Looking at long-term trends gives a fuller view of a country’s economic health4. An economy growing 3% a year will double in 24 years, but one growing 1% will take 48 years to do the same4. This idea of growth adding up over time is crucial for economic success, yet it’s often overlooked.
Importance of Long-term GDP Growth Trends
Looking at GDP growth rates helps us see how different countries and areas are doing economically4. Over 18 years, the European Union saw an average growth of 1.2%, while the Eurozone was slightly behind at 1.1%4. These small differences in growth can lead to big differences in the economy over time.
Compound Interest and Economic Prosperity
Compound interest is key in economics, but many don’t fully grasp its power4. Small changes in growth rates can mean big differences in prosperity over years. Countries like Malta and Ireland, with growth rates of 4.9% and 4.8% from 2005 to 2023, grew much faster than the EU average4. This shows how crucial it is to have policies that support steady, growing economies.
| Metric | Value |
|---|---|
| European Union Population | 448,753,823 (EU27, 1 January 2023 prov. est.)5 |
| European Union Nominal GDP | $18.98 trillion (2024)5 |
| European Union GDP per Capita (Nominal) | $43,300 (2024)5 |
| European Union GDP by Sector | Agriculture 1.5%, Industry 24.5%, Services 70.7% (2016 est.)5 |
Understanding long-term economic growth and how it adds up helps policymakers make better choices. This way, they can work towards lasting prosperity in their countries and regions.
Europe’s Sluggish Economic Growth
The European Union’s economy has seen slow growth in recent years. Even as the world recovered from COVID-19, the EU’s economy shrank in the last quarter of 2022 and grew slowly in 20236. The Autumn Forecast says the EU and euro area will grow by 0.6% in 2023, less than expected6. This is much slower than the strong growth seen in places like the United States.
Reasons Behind Lagging Growth Rates
Europe faces several challenges that slow its growth. The EU has a low rate of new businesses and doesn’t invest much in things like roads and bridges7. It also grows more slowly in productivity compared to the US, even though it has grown faster since joining the EU6. This has made Europe fall behind the US in economic growth7.
The EU’s economy is expected to grow more in 2024 and 2025, but not as much as it could6. The euro area is expected to grow even less, at 1.2% in 2024 and 1.6% in 20256. This slow growth is a big concern for Europe’s future wealth and competitiveness.
“Europe’s economic growth has been deeply disappointing, with the Euro Area falling behind the US since the 1980s.”
Europe’s slow growth comes from many issues, like not being able to compete with other big economies. Fixing these problems is key to Europe’s future success.
US States and European Countries: GDP Per Capita Ranking
Comparing GDP per capita between US states and European countries shows a worrying trend. Big European economies like France and Germany now have lower GDP per capita than some US states8. For example, France’s GDP per capita is less than Arkansas’, the 48th poorest US state, and Germany’s is like Oklahoma’s, the 38th state8. This trend shows a big gap in economic success between the EU and the US.
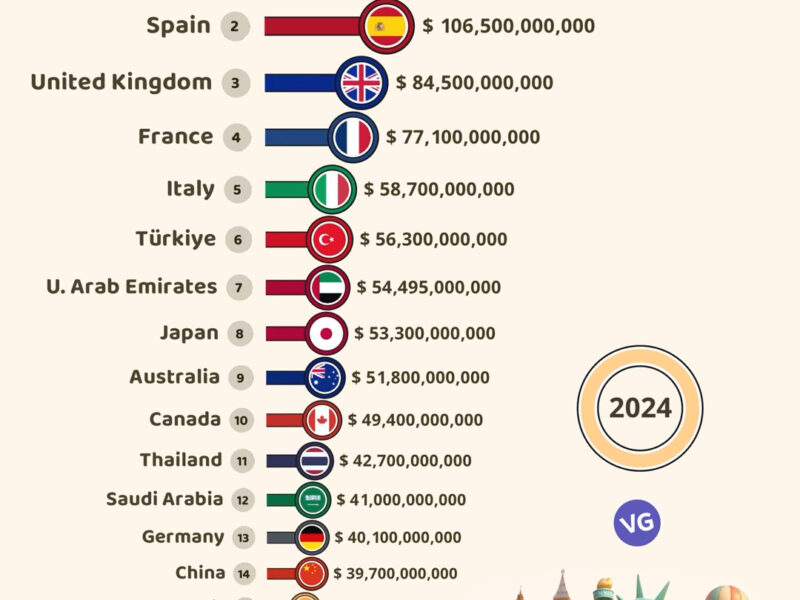
The US has a GDP per capita of $85,373 in 2024, ranking 15th globally9. Luxembourg, with $132,400 in 2023, is second, and Liechtenstein tops the list with $139,100 in 20099. These numbers show big differences in economic wealth and living standards between countries10.
| Country/State | GDP Per Capita (USD) |
|---|---|
| Monaco | $240,8628 |
| Liechtenstein | $197,5058 |
| Luxembourg | $131,3848 |
| Bermuda | $118,7758 |
| Switzerland | $105,6698 |
| Ireland | $106,0598 |
| Norway | $94,6608 |
| Singapore | $88,4478 |
| United States | $85,3738 |
| Qatar | $81,4008 |
European countries like Luxembourg, Liechtenstein, and Switzerland lead in GDP per capita, while the US ranks 15th9. This gap in economic success between the EU and the US is worrying. It needs more study and policy action to close the gap.
The big difference in GDP per capita between the US and Europe shows we need to understand why these economic paths are different10. Policy makers and economists should look into why this gap is growing. They need to find ways to boost economic growth and prosperity in both regions.
US States and European Countries: GDP Comparison 2023
The economic gap between the US and Europe has grown in 2023. The US is expected to see a strong GDP growth of 2.4% this year. In contrast, the eurozone is forecasted to grow by only 1.8%11. This shows the US’s strong economic growth, with a predicted 2.3% increase in consumer spending and 3% growth in business investment in 202412.
| Country/State | GDP (in billions) |
|---|---|
| United States | $24.893 trillion11 |
| European Union | $23.674 trillion11 |
| Germany | $4,591.100 billion13 |
| United Kingdom | $3,495.261 billion13 |
| France | $2,936.702 billion13 |
| Italy | $2,120.232 billion13 |
| Russia | $1,464.078 billion13 |
| Spain | $1,582.050 billion13 |
| Netherlands | $1,092.750 billion13 |
| Turkey | $1,154.060 billion13 |
| Switzerland | $841.969 billion13 |
| Poland | $842.172 billion13 |
This GDP comparison shows a big economic gap between the US and Europe. The US GDP has reached $26.9 trillion, while the eurozone is around $15 trillion. This means the gap between the average American and European has grown a lot over 15 years11.
The US economy is expected to keep growing, but Europe faces challenges like geopolitical tensions, high inflation, and slow growth. Policymakers must work to bridge this economic gap and improve growth in the future.
Labor Productivity Trends
Productivity growth is key to economic success. Yet, the trends in labor productivity differ between the US and Europe. From 1997 to 2022, the median economy productivity jumped sixfold, from about $7,000 to $41,000 per employee, at a yearly growth rate of 7.3%14. However, the global productivity growth rate was only 2.3% annually over the same period14.
Divergence in Productivity Growth
In advanced economies, productivity growth slowed down. It went from an average of 2.2% per year before 2002 to less than 1% from 2012 to 202214. Emerging economies saw productivity growth speed up before the global financial crisis, then slow down again14. Without China and India, productivity growth in emerging economies dropped from 3.5% to 1.3%14.
Investment is crucial for emerging economies to stay competitive. Fast-lane economies keep investing 20 to 40% of their GDP14. The world needs more productivity growth to improve living standards despite challenges like aging populations and the energy transition14. By investing more, advanced economies could see an increase of $1,500 to $8,000 in GDP per capita by 203014.
The US and Europe have seen different trends in productivity growth. The US recovered faster from the COVID-19 pandemic than other advanced foreign economies15. Strong final consumption and domestic investment helped the US outperform15. The US also had a bigger deficit and provided more fiscal support, which helped its recovery15.
For 2024, the focus is shifting to labor productivity driving growth, with 77% of GDP growth coming from productivity gains16. Technological advancements, like generative AI, could boost investment and productivity16. Labor productivity growth is now seen as key to future GDP growth due to labor shortages and demographic changes16.
“The world faces a significant need for productivity growth to raise living standards amid various challenges including aging populations, the energy transition, and supply chain reconfigurations.”
Purchasing Power Parity and Consumption Gap
The economic gap between Europe and the US is clear when we look at purchasing power parity (PPP) and the consumption gap. In 2008, Europe and the US had similar consumption levels. But now, the US is 57% ahead17. The average American earns 1.5 times more than someone in France, showing a big difference in living standards17.
Looking at PPP-adjusted GDP, we see Europe and the US were even in 2000. But by 2022, the EU was 4% smaller17. The EU has gotten closer to the US in GDP per person, from 67% in 1995 to 72% in 202217.
But, the story changes when we look at Europe’s individual countries. Eastern EU countries have caught up a lot, with their GDP per person now 55% of the US level17. Yet, Europe still lags behind the US in consumption. In 2022, Europe’s GDP per person was 27% less than the US18.
| Indicator | Europe | United States |
|---|---|---|
| GDP per capita (PPP) | 73% of US level | 100% of US level |
| Consumption per capita (PPS) | 58% of US level | 100% of US level |
| R&D spending | Roughly 50% of US level | 100% of US level |
| Market capitalization | 40% of US level | 100% of US level |
| AI investment | $1.7 billion | $23 billion |
The data shows a big difference in economic performance and living standards between Europe and the US. The US leads in many areas1718. This gap affects the global economy and politics.

“The recovery of consumption in the EU has been slower post-pandemic compared to the US, however, the relative position of consumption per capita returned to 58% in 2022.”17
Central and Eastern European Economies
Countries in Central and Eastern Europe have seen big growth in GDP per capita since joining the European Union19. Yet, their small size and lower starting point haven’t changed Europe’s economic decline trend compared to the United States.
The combined GDP per capita of the EU’s 27 countries is about 72% of the US level19. This gap is mainly because US workers put in more hours each year. For example, the average French worker puts in 1,511 hours, and the average German worker 1,341 hours19. So, the EU’s lower GDP per capita is mostly due to working fewer hours, not being less productive.
Even though Central and Eastern European countries are growing faster, their effect on Europe’s economy is small20. The EU’s GDP growth is expected to hit 1.0% in 2023, with the euro area at 1.1%20. These numbers show progress but still trail behind the US economy.
The Central and Eastern European economies face many challenges, like poor infrastructure, skill gaps, and weak institutions20. Fixing these issues is key to unlocking the potential of these markets. It will help make the European economy more balanced and prosperous.
Europe’s Unfulfilled Economic Potential
The United States has shown strong economic growth, but Europe has struggled to match that pace21. The Euro area saw a 3.3% GDP growth in 2022, but it’s expected to slow down to 0.8% in 2023 and 1.3% in 202421. The European Union also saw a 3.4% GDP growth in 2022, but it’s forecasted to drop to 0.8% in 2023 and reach 1.4% in 202421.
Not all countries in Europe are growing at the same pace. Germany and France are facing bigger challenges21. Germany’s growth is expected to be 1.8% in 2022, then drop to -0.4% in 2023, and finally reach 1.1% in 202421. France saw a 2.5% growth in 2022 but is expected to slow down to 1.0% in 2023 and 1.2% in 202421.
Europe’s slow growth is due to many factors, including structural issues and policy limits22. The Conference Board predicts a 2.7% GDP growth for the Euro Area in 2022 and only 1.2% in 202322. The European Central Bank plans to raise interest rates in July 2022, which could slow the economy further without tackling inflation effectively22.
It’s vital to address Europe’s economic potential to tackle climate change, digital transition, and aging populations23. Despite the global economy growing by 3.1% in the first half of 2023, the euro area only grew by 0.1% in the year to the third quarter of 202323. Many countries, especially in Central and Eastern Europe, saw their output decline23.
To unlock Europe’s economic potential, we need to focus on policies that boost growth, competitiveness, and innovation22. European CEOs are planning to invest more in the short term, showing they’re committed to growth22. By combining this entrepreneurial spirit with effective policies, Europe can unlock its economic power and secure a prosperous future.
Geopolitical Implications of Economic Divergence
The growing wealth gap between Europe and the US has big geopolitical effects23. If things keep going this way, the gap could be huge by 2035. It could change who has the most power worldwide23. This change could deeply affect how the world is balanced and who gets to make decisions.
Prosperity Gap and Global Power Dynamics
The US economy has grown faster than many European countries lately23. The euro area’s economy only grew a tiny bit in 202323. But, some Central and Eastern European countries saw their output drop23. The US, on the other hand, has seen better growth23. If this keeps up, it could make the wealth gap bigger, changing who has power globally.
This gap isn’t just about GDP growth23. Things like how productive workers are, business investment, and inflation rates also differ a lot23. As the US keeps doing better than Europe, it could change how the world is run and who has influence.

How well a country does economically affects its power24. The EU’s growth is expected to slow down in 202424. The US growth is also expected to slow, from 2.5% in 2023 to 1.4% in 202424. This could change who has power globally24. As the gap grows, the US and Europe’s influence might change.
“The prosperity gap between Europe and the US could become as large as between the average European and Indian today, reshaping global power dynamics.”
Leaders and policymakers need to watch this economic gap and its effects23. They should work on fixing the issues that cause the gap. This will help keep the world stable and cooperation strong.
Policy Recommendations for Economic Revival
To fix Europe’s economic issues, we need to focus on growth and competitiveness. Getting the economy to grow fast is key for everyone’s well-being and future. It helps solve big problems like climate change too.
Prioritizing Growth and Competitiveness
Deloitte predicts the US will grow by 2.4% in 2024, but slow down to 1.1% in 202525. The EU is expected to grow by only 0.6% in 2023, which is less than expected6. To catch up, Europe needs a strong plan that boosts innovation, productivity, and competitiveness.
This plan should include:
- Investing in research and development for new tech
- Improving education and skills to make a skilled workforce
- Making rules simpler and cutting down on business hurdles
- Supporting industries that sell products abroad and diversifying trade
- Creating tax policies that encourage investment and starting new businesses
By focusing on growth and competitiveness, Europe can become a leading economic force again. This will give its people a brighter future.
“Restoring high rates of economic growth is crucial for prosperity, welfare, opportunity, and the ability to tackle other pressing issues like climate change.”
Europe needs a big change in how it makes policies. Policymakers must act fast to fix the slow growth and unlock Europe’s full economic potential.256
Challenges Ahead
The European economy is facing slow growth, which brings many challenges. Climate change, digital changes, and changes in the population are making things harder. These issues threaten Europe’s future26.
Climate Change, Digital Transition, and Aging Populations
Climate change is a big threat to Europe, causing problems already26. Things like extreme weather, rising sea levels, and the need for renewable energy are big challenges. The digital revolution is also changing how industries work, needing more investment and skills to stay ahead26.
Europe’s aging population adds to the problems, putting pressure on social welfare and the job market26. With fewer young people working, Europe must find ways to be more productive and keep its economy strong.
To solve these big issues, Europe needs faster economic growth. This growth will help with climate change, digital changes, and supporting older people26. But, Europe is finding it hard to grow as fast as the US, which is more adaptable.
| Indicator | United States | European Union |
|---|---|---|
| GDP Growth (2023) | 2.5%27 | Close to 0%26 |
| Unemployment Rate | 3.8%28 | 6.4%28 |
| Inflation (Core) | 4.1%28 | Higher than US28 |
| Government Spending | $5 trillion in pandemic relief26 | Budget cuts amid economic hardships26 |
European leaders need to come up with new and bold solutions to these challenges26. Overcoming these economic hurdles is key to Europe’s future and its role in the world.
Conclusion
This article has shown a big gap in the economy between the US and Europe. The US economy is now 50% bigger than the EU’s, up from almost the same size in 201029. In 2022, the EU-27 economy was just 95.6% the size of the US, a small drop from 201029. Since 2010, the US has grown 8% more than the EU, with a bigger increase in per capita GDP.
The differences in economy affect the EU’s global position and influence. The US created 19 million new jobs since 2010, while the EU made 16 million. Hours worked per employee stayed the same in the US but went down in Europe29. The US has an edge in energy costs thanks to its shale oil and gas, unlike Europe29. With an aging population, the EU needs each worker to work almost 2% more to match the US’s per capita GDP level29.
Europe needs to focus on growth and competitiveness to tackle its big challenges, like climate change and digital transformation. By focusing on these areas, the EU can catch up with the US economically. It’s crucial to act now, as the world’s power balance depends on the economic success of countries and regions.
FAQ
What are the key economic trends when comparing US states and European countries?
Many European countries like France and Germany now have lower GDP per capita than some US states. This gap in GDP per capita between the EU and the US is growing. It’s a worrying trend.
Why has Europe’s economic growth been deeply disappointing compared to the US?
Europe’s growth is slow due to several reasons. These include low market churn, lack of firm dynamism, and underinvestment in infrastructure. Also, productivity growth in the Euro Area is slower than in the US. Yet, the EU as a whole has seen faster productivity growth after expanding.
How do the GDP figures of US states and European countries compare in 2023?
Over the past 15 years, the GDP gap between the eurozone and the US has widened. The US GDP has reached .9 trillion, while the eurozone’s is just over trillion. This shows a big prosperity gap between Europeans and Americans.
What are the key labor productivity trends between Europe and the US?
Productivity has grown faster in the US than in the Euro Area over time. Even though the EU’s productivity has grown faster after expanding, there’s still a gap between the Euro Area and the US. Looking into productivity growth reveals differences between the two regions.
How does the purchasing power parity (PPP) and consumption gap compare between Europe and the US?
In 2008, European and American consumption were similar. But now, the US is 57% ahead, with the average American earning 1.5 times more than in France. This shows a growing gap in living standards between the two regions.
What are the geopolitical implications of the growing prosperity gap between Europe and the US?
If this trend keeps going, the gap between the average European and American could be as big as between the average European and Indian by 2035. This could change global power dynamics.
What policy recommendations are made to address Europe’s economic challenges?
Policymakers should focus on growth and competitiveness in their economic policies. Boosting economic growth is key for prosperity, welfare, and tackling issues like climate change.
Source Links
- Comparing Economic Growth between EU and US States | – https://ecipe.org/publications/comparing-economic-growth-between-eu-and-us-states/
- PDF – https://ecipe.org/wp-content/uploads/2023/06/ECI_23_PolicyBrief_07-2023_LY02.pdf
- ‘The GDP gap between Europe and the United States is now 80%’ – https://www.lemonde.fr/en/opinion/article/2023/09/04/the-gdp-gap-between-europe-and-the-united-states-is-now-80_6123491_23.html
- National accounts and GDP – Statistics Explained – https://ec.europa.eu/eurostat/statistics-explained/index.php/National_accounts_and_GDP
- Economy of the European Union – https://en.wikipedia.org/wiki/Economy_of_the_European_Union
- Autumn 2023 Economic Forecast: A modest recovery ahead after a challenging year – https://economy-finance.ec.europa.eu/economic-forecast-and-surveys/economic-forecasts/autumn-2023-economic-forecast-modest-recovery-ahead-after-challenging-year_en
- Europe’s economic pain drags on with zero growth at the end of last year – https://apnews.com/article/economic-growth-europe-recession-red-sea-trade-2b28c78474cf9ed2f3d28e85e9458bc9
- List of countries by GDP (nominal) per capita – https://en.wikipedia.org/wiki/List_of_countries_by_GDP_(nominal)_per_capita
- No title found – https://www.cia.gov/the-world-factbook/field/real-gdp-per-capita/country-comparison
- GDP per Capita – Worldometer – https://www.worldometers.info/gdp/gdp-per-capita/
- Countries & Regions – IEA – https://www.iea.org/countries
- United States Economic Forecast – https://www2.deloitte.com/us/en/insights/economy/us-economic-forecast/united-states-outlook-analysis.html
- List of sovereign states in Europe by GDP (nominal) – https://en.wikipedia.org/wiki/List_of_sovereign_states_in_Europe_by_GDP_(nominal)
- Investing in productivity growth – https://www.mckinsey.com/mgi/our-research/investing-in-productivity-growth
- Why is the U.S. GDP recovering faster than other advanced economies? – https://www.federalreserve.gov/econres/notes/feds-notes/why-is-the-u-s-gdp-recovering-faster-than-other-advanced-economies-20240517.html
- Total Economy Database™ – Key Findings – https://www.conference-board.org/data/economydatabase
- The European Union’s remarkable growth performance relative to the United States – https://www.bruegel.org/analysis/european-unions-remarkable-growth-performance-relative-united-states
- Accelerating Europe: Competitiveness for a new era – https://www.mckinsey.com/mgi/our-research/accelerating-europe-competitiveness-for-a-new-era
- Comparing EU-to-US Output Per Hour – Conversable Economist – https://conversableeconomist.com/2023/10/27/comparing-eu-to-us-output-per-hour/
- Spring 2023 Economic Forecast: an improved outlook amid persistent challenges – https://economy-finance.ec.europa.eu/economic-forecast-and-surveys/economic-forecasts/spring-2023-economic-forecast-improved-outlook-amid-persistent-challenges_en
- PDF – https://economy-finance.ec.europa.eu/system/files/2023-09/ip255_en.pdf
- Why the Recession Risk Is Overrated – https://www.conference-board.org/topics/geopolitics/why-the-recession-risk-is-overrated
- Home – https://www.oecd-ilibrary.org/sites/7a5f73ce-en/1/3/1/index.html?itemId=/content/publication/7a5f73ce-en&_csp_=ff1338015957b6cc89df6710d74ff9f1&itemIGO=oecd&itemContentType=book
- Overview – World Economic Situation and Prospects 2024 – United Nations Sustainable Development – https://www.un.org/sustainabledevelopment/blog/2024/01/overview-world-economic-situation-and-prospects-2024/
- United States Economic Forecast – https://www2.deloitte.com/xe/en/insights/economy/us-economic-forecast/united-states-outlook-analysis.html
- What Is Going On With Europe’s Economy? – https://www.theatlantic.com/ideas/archive/2024/03/america-europe-post-pandemic-growth-comparison/677617/
- Why US economy is powering ahead of Europe’s – https://www.bbc.com/news/world-us-canada-68203820
- The U.S. Economy in Global Context – https://home.treasury.gov/news/featured-stories/the-us-economy-in-global-context
- Why Europe should not worry about US out-performance – https://www.cer.eu/insights/why-europe-should-not-worry-about-us-out-performance