In 1950, the world produced only 6 billion tonnes of carbon dioxide (CO2) per year. By 1990, this number had grown to over 20 billion tonnes. Today, we emit a staggering 35 billion tonnes of CO2 annually. This increase in co2 emissions in the world is driving climate change, which puts the planet at risk. It’s vital to understand where the largest source of co2 emissions in the world comes from. This knowledge helps nations fight the severe impacts of climate change.
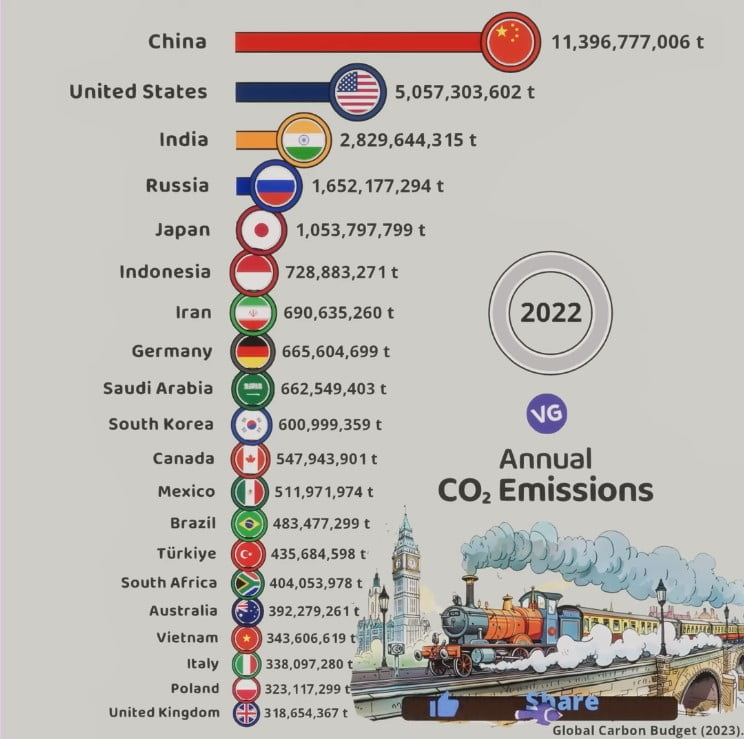
largest co2 Emitters in The World 2022
| Rank | Country | Region | Total Emissions (%) |
|---|---|---|---|
| #1 | 🇨🇳 China | Asia | 30.9% |
| #2 | 🇺🇸 U.S. | North America | 13.5% |
| #3 | 🇮🇳 India | Asia | 7.3% |
| #4 | 🇷🇺 Russia | Europe | 4.7% |
| #5 | 🇯🇵 Japan | Asia | 2.9% |
| #6 | 🇮🇷 Iran | Asia | 2.0% |
| #7 | 🇩🇪 Germany | Europe | 1.8% |
| #8 | 🇸🇦 Saudi Arabia | Other | 1.8% |
| #9 | 🇮🇩 Indonesia | Asia | 1.7% |
| #10 | 🇰🇷 South Korea | Asia | 1.7% |
| #11 | 🇨🇦 Canada | North America | 1.5% |
| #12 | 🇧🇷 Brazil | South America | 1.3% |
| #13 | 🇹🇷 Türkiye | Europe | 1.2% |
| #14 | 🇿🇦 South Africa | Africa | 1.2% |
| #15 | 🇲🇽 Mexico | North America | 1.1% |
| #16 | 🇦🇺 Australia | Oceania | 1.1% |
| #17 | 🇬🇧 UK | Europe | 0.9% |
| #18 | 🇮🇹 Italy | Europe | 0.9% |
| #19 | 🇵🇱 Poland | Europe | 0.9% |
| n/a | 🌐 Rest of World | Other | 21.7% |
Key Takeaway
- Global CO2 emissions have quadrupled since 1950, reaching over 35 billion tonnes annually.
- Fossil fuel emissions have increased significantly, while emissions from land-use change have slightly declined.
- The United States and Europe now account for less than one-third of global emissions, as Asia, particularly China, has emerged as a major emitter.
- Per capita CO2 emissions vary widely, with developed countries like the US, Australia, and Canada having emissions up to 3 times the global average.
- China is the world’s largest emitter, accounting for over 29% of global CO2 emissions, followed by the US at 14%.
Introduction to Global Carbon Emissions
Annual CO2 Emissions (2022)
Source: Global Carbon Budget (2023)
Greenhouse gas emissions are increasing worldwide. Carbon dioxide (CO2) is the main cause of climate change. Everyone knows that we must cut emissions fast to avoid the worst effects of climate change. Ways to compare emissions include looking at yearly emissions by country, emissions per person, past contributions, and if they include goods and services that were traded.
Overview of Greenhouse Gas Emissions
From 1990 to 2019, global greenhouse gas emissions have gone up by 53%. The biggest share, 75.6%, comes from the energy sector. This section covers things like transportation and making electricity. It adds up to 37.6 billion tonnes of CO2 equivalents (GtCO2e).
Agriculture, with its livestock and crops, is responsible for 11.6% of these emissions. Industrial activities, including making chemicals and cement, make up 6.1%. Finally, waste, like what’s found in landfills, contributes 3.3%.
Impact of Carbon Emissions on Climate Change
Since 1961 to 1990, the global average temperature has gone up by more than 0.8°C. The Northern Hemisphere is warming faster than the South. Some places have seen their temperature rise by more than 5°C. If we keep going as we are now, global emissions could lead to a 2.7°C temperature increase by 2100. This is much higher than the 1.5°C limit needed to avoid severe climate change impacts.
The UK and the European Union have made big cuts in their emissions. But, the top 10 emitters still account for 68% of the world’s greenhouse gas emissions. China comes first at 26.4%, and the United States is second at 12.5%.
Ranking of Countries by Total Carbon Emissions
A few nations lead in global carbon emissions. In 2020, China, the United States, and India topped the list. Together, they contributed to more than half of the world’s CO2 emissions.
Top Emitters: China, United States, and India
China took the lead by emitting 11.68 gigatons of CO2. The United States and India were next, adding 4.54 and 2.52 gigatons respectively. Their collective efforts make up a big part of the world’s pollution.
Emerging Economies and Their Contribution
Outside these top nations, emerging economies are becoming key players in emitting CO2. In 2020, the top ten emitters accounted for about two-thirds of global emissions. This list included countries like Russia, Japan, and Germany.
The rise in emissions from these countries shows the need for everyone to work together. It’s clear that stopping climate change will take a worldwide effort.
| Rank | Country | CO2 Emissions (Mt) | Percentage of Global Emissions |
|---|---|---|---|
| 1 | China | 12,667 | 32.6% |
| 2 | United States | 4,854 | 12.5% |
| 3 | India | 2,597 | 6.7% |
| 4 | Russia | 1,547 | 4.0% |
| 5 | Japan | 1,083 | 2.8% |
These stats underline the importance of joining forces to tackle the climate crisis. While the top three countries are significant, developing nations are also crucial. To make real change, everyone must be part of the solution.
Per Capita Carbon Emissions by Country
Per capita figures are key in understanding carbon emissions’ global impact. They show big differences in each country’s carbon footprint. This points out the major inequalities in the world’s total carbon output.
Major oil producers in the Middle East like Qatar, the United Arab Emirates, Bahrain, and Kuwait lead the way in personal CO2 emissions. In 2016, Qatar topped the list with a record 38.14 tons of CO2 per person.
In comparison, the United States had 15.32 tons per person, ranking second globally. This figure is better than Qatar, but still higher than the world’s average. China, despite its huge population, had lower per capita emissions of 7.44 tons the same year.
Now, India stood out by having just 1.89 tons per person despite being the top three global emitter. This shows how different the emissions are between rich and poorer countries.
When looking at the top 30 countries, Macao came first with 4.96 tons per person. Kuwait followed closely with 25.07 tons. Even smaller places like Bermuda and Gibraltar had high emissions of 10.14 and 17.59 tons, respectively.
On the flip side, Burundi and Tanzania had the lowest emissions at 0.10 and 0.18 tons per person. They are among many nations with per person emissions under 1 ton. This underlines their small impact on the planet’s carbon problems.
The wide gaps in per capita emissions highlight the difficulty of solving the global climate issue. As we seek fair and lasting ways to reduce carbon, looking at each country’s contribution is more important than ever.
“The top 10 countries with the highest CO2 emissions accounted for almost two-thirds of the global total in 2022.”
Carbon Emissions from Fossil Fuel Consumption
Fossil fuels are a big part of the problem with CO2 emissions worldwide. In 2022, we saw a rise in CO2 emissions from using these fuels. They hit over 36.8 billion metric tons, the highest ever.
This change was mainly because more coal and oil was being used. This led to their emissions hitting new peaks.
Role of Energy Sources in Emissions
The main cause of CO2 emissions globally is the energy sector. It makes up over 75% of all emissions. Burning coal, oil, and natural gas for making electricity, moving around, and industry is what causes this.
In 2022, coal emissions went up by 1.6%, and oil emissions increased by 2.5%. While natural gas emissions fell by 1.6%, it didn’t make up for the increase in coal and oil.
Efforts to Transition to Renewable Energy
There’s a big push to switch to cleaner energy to reduce CO2. Things like solar, wind, and hydropower help with this. In 2022, these cleaner technologies stopped an extra 550 million metric tons of CO2 from entering the air.
But, we need to move even faster to hit the goals of the Paris Agreement. This aims to keep the Earth from getting more than 2°C warmer. That’s a challenge we all must work hard to meet.
| Energy Source | Change in CO2 Emissions (2022) |
|---|---|
| Coal | +1.6% (243 Mt) |
| Oil | +2.5% (268 Mt) |
| Natural Gas | -1.6% (-118 Mt) |
| Renewable Energy | -550 Mt (prevented emissions) |

Shifting to renewable energy is key for lowering CO2 from fossil fuels. Everyone, from governments to businesses to people, must work together. Together, we can tackle climate change by choosing clean energy.
World’s Carbon Emissions by Country
The global carbon dioxide (CO2) emissions are majorly influenced by the top emitters, shaping our environment. The latest data is full of insights on which countries are the key contributors to CO2 production.
China leads the world in CO2 emissions. It released 11,336 million metric tons in 2021, comprising nearly 30% of the global amount. It’s followed by the United States, which contributed 5,032 million metric tons, or 13.3% of the total.
India, Russia, and Japan come next in the list of top emitters. They respectively released 2,674 million, 1,712 million, and 1,602 million metric tons of CO2. These five countries combined produce over half of the world’s CO2 emissions.
| Country | CO2 Emissions (million metric tons, 2021) | Share of Global Emissions (%) |
|---|---|---|
| China | 11,336 | 29.9% |
| United States | 5,032 | 13.3% |
| India | 2,674 | 7.0% |
| Russia | 1,712 | 4.5% |
| Japan | 1,602 | 4.2% |
These numbers highlight the crucial part these top emitters play in fighting climate change and moving towards a greener planet.
“Addressing climate change requires a global effort, with all nations playing their part in reducing greenhouse gas emissions.”
Historical Trends in Carbon Emissions
The story of global carbon dioxide emissions shows big changes in the last centuries. Before the Industrial Revolution, emissions were low. This was because human activities were not as big as today. They mostly used renewable energy.
But with industrialization in the late 18th century, things changed. Carbon emissions started growing fast.
In 1850, early in the industrial period, the world was emitting only 200 million tonnes of carbon. By 1950, this had gone up to 6 billion tonnes. The growth kept speeding up. In 1990, global CO2 output was over 20 billion tonnes. Now, it’s over 35 billion tonnes every year.
Industrial Revolution and Emissions Growth
The Industrial Revolution changed everything. It transformed the economy and the way we use energy. The use of coal for factories, transport, and heating rose quickly. This caused a big jump in historical trends in co2 emissions.
The United States increased its emissions share a lot after 1950. This was because of its strong industrial progress.
Recent Developments and Future Projections
Recently, the rise in industrial revolution and growth in co2 emissions has slowed. But cutting down on emissions is still a big challenge. Countries worldwide are working to use more clean energy and new tech. They want to lessen the impact of future projections of co2 emissions.
Reducing carbon output needs a global team effort. It calls for new, smart solutions to stop the rise in greenhouse gases.
Regional Disparities in Carbon Emissions
The world’s carbon emissions vary greatly from region to region. In the past, Europe and the U.S. were the main contributors. They accounted for over 90% of emissions in the 1900s and around 85% in 1950. But now, places like China and India are making a big impact, too.
Developed vs. Developing Nations
When we look at carbon emissions, we see a big gap between rich and poor countries. High-income places emit a lot more CO2 per person than low-income areas. High- and upper-middle-income countries create over 80% of the CO2, though they’re less than half the world’s population.
In comparison, low- and lower-middle-income countries only make up for a small amount of CO2. The very poorest emit the least, under 1% of the world’s CO2. This shows a clear difference in who is mostly to blame for climate issues.
Looking at how much CO2 each person makes, we see more contrasts. China’s output is higher than the global average, but India’s is lower for Asia. Areas like Europe and North America create more CO2 than their fair share. But, Africa and South America do the opposite, making less CO2.
Even when considering trade, the big picture stays the same. Adjusting for what countries buy and sell, 80% of CO2 still comes from the richer places. Wealthier countries are polluting more than they should, and poorer countries are doing better, even with trade.
There’s a huge difference in carbon emissions between rich and poor countries. This challenge shows how hard it is to fight climate change on a global scale. It’s very important to work on this gap to come up with fair plans to address climate change’s worst effects.
Impact of COVID-19 on Global Carbon Emissions
The COVID-19 pandemic greatly reduced global carbon emissions. In 2020, emissions dropped by 5.3% compared to 2019. This was the biggest one-year decrease ever. It happened mainly because the world slowed down due to the pandemic.
As things started to get back to normal, emissions quickly rose again. By the end of 2020, they were almost as high as before the pandemic. In 2021, emissions were just slightly lower than they were in 2019. This shows that the drop was only temporary.
The effect on different sectors varied. During the pandemic, methane emissions decreased by 10%. But, the amount of methane in the air went up as fast as before. However, fewer nitrogen oxides led to ozone levels dropping, affecting methane cleansing.
The rise in emissions in 2021 indicates a temporary nature for the 2020 decrease. We need to switch to technology that doesn’t emit a lot of carbon. This is crucial for keeping emissions low in the long term.
| Indicator | Change in 2020 vs 2019 |
|---|---|
| Global CO2 emissions | -5.3% |
| Methane emissions | -10% |
| Ozone levels | Decreased |
| Global GDP | -3.6% |
The pandemic has shown the urgency of tackling our contribution to CO2 emissions. 2020’s improvements were not enough to counteract the long-term rise in greenhouse gases. It’s crucial we keep making policies and new technology to reduce emissions for real.
International Agreements and Emission Reduction Targets
International agreements are key in the global fight against climate change. They set emissions reduction targets and guide collective action. The Paris Agreement is a key example, started in 2015 under the United Nations.
Paris Agreement and Its Goals
The Paris Agreement’s goal is to keep global warming well below 2°C. Ideally, efforts will reach for a 1.5°C limit. Countries must regularly update their Nationally Determined Contributions (NDCs) to show how they plan to cut emissions.
- By 2022, 197 countries had agreed to the Paris Agreement, covering nearly 90% of global emissions.
- The agreement includes regular global stocktakes to check how well we’re doing.
- Results from the 2023 stocktake showed countries aren’t meeting the Paris Agreement’s key aims. This underlines the need for more effort right now.
Other key initiatives include:
- The Montreal Protocol has cut 99% of ozone-depleting substances since 1987.
- The Kyoto Protocol made developed countries reduce emissions by 5% below 1990 levels after its adoption in 1997.
- The Intergovernmental Panel on Climate Change (IPCC) shares vital climate change reports since 1988.
- At COP27, the Loss and Damage Fund was created to help poorer countries deal with climate impacts.
To limit global warming to 1.5°C by 2030, we need to cut global emissions by 45%. Achieving this needs strong international teamwork and effective local strategies.

Strategies for Mitigating Carbon Emissions
The world is facing a big challenge with climate change. All around the globe, governments, industries, and people are working on ways to reduce carbon emissions. Their goal is a more sustainable future. They are focusing on using more renewable energy and developing technologies to capture and store carbon.
Renewable Energy Solutions
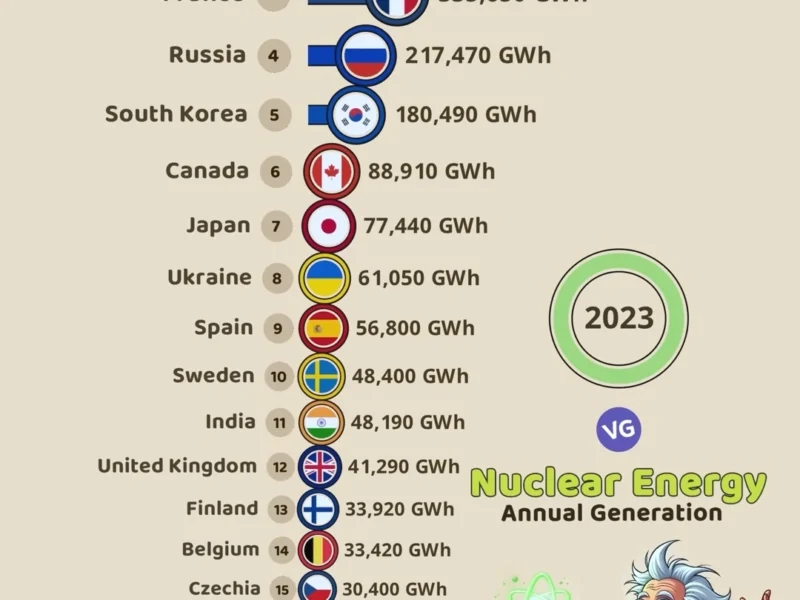
Switching to renewable energy is key to fighting climate change. Countries like France, Portugal, and the UK are good examples. They heavily use nuclear and renewable energy and have cut their carbon footprints. They are doing better than countries with similar lifestyles but different energy strategies. This shows how important policy and technology are in reducing carbon emissions.
The European Union (EU) stands out as a renewable energy leader, lowering emissions by over 31% in 2022 from 1990 levels. This success came from using more renewables and dropping the use of fossil fuels. The EU aims to cut emissions by over 55% from 1990 levels by 2030. They also plan to be climate neutral by 2050.
Carbon Capture and Storage Technologies
Besides renewable energy, carbon capture and storage (CCS) is another key technology. CCS captures carbon dioxide and stores it underground. It’s useful for sectors that find it hard to reduce emissions, like heavy industry.
The EU is also a leader in CCS, aiming to drastically cut greenhouse gases by 2030. Its European Green Deal pushes for more green jobs and sustainable transportation. It also asks other countries to join in limiting temperature rises to 1.5°C.
Climate change is urgent, but there are ways to tackle it. Using renewable energy and advanced technologies like CCS gives hope for a greener future.
Conclusion
In short, the data shows a clear picture of global carbon emissions. China, the United States, and India are top emitters, making up most emissions. Also, wealthier countries often produce more per person than poorer ones.
The world has been trying to lower these emissions, especially with more use of renewable energy. However, we still have a long way to go. To limit global warming to 1.5°C, we need to cut down emissions by 43% before 2030.
To achieve this goal, experts say we must stop using coal by 2040 and reduce our oil and gas usage. This change is vital to keep our planet safe for the future.
So, we need to keep working together globally. We must come up with strong plans and new technologies. This way, we can move towards a future with less carbon. The information in this article is key for making smart choices and taking action against climate change.
FAQ
What is the primary driver of global climate change?
The first source points to carbon dioxide emissions as the big issue behind global warming. People all over the world need to cut down on these emissions fast. This is to prevent the harshest effects of climate change.
How are carbon emissions compared globally?
The article looks at different ways to compare emissions. It talks about which countries emit the most each year. And also how past actions play a part. These ways of looking at it tell different stories. They help see who should act the most to fight climate change.
Who are the top emitters of CO2 in the world?
The second source shows that China, the United States, and India were the top three emitters in 2021. They produced almost half of the world’s CO2 emissions that year.
Which countries have the highest per capita CO2 emissions?
The first source highlights a big gap in how much CO2 each person produces. Countries in the Middle East, like Qatar and the United Arab Emirates, lead in this. They are the biggest CO2 emitters per person in the world.
How have global carbon dioxide emissions changed over time?
Before the Industrial Revolution, emissions were low. But they started to rise slowly. By 1950, the world was emitting much more CO2. From then on, emissions quickly increased. Now, they are over 35 billion tonnes each year.
How have regional contributions to global carbon emissions changed over time?
The first source says Europe and the United States used to be the main emitters. But other regions have caught up. Now, emissions are caused by many countries. These countries share the responsibility to cut down on emissions.
How did the COVID-19 pandemic impact global carbon emissions?
The third source looks at how the pandemic affected emissions. In 2020, emissions dropped by 5.3%. This was because of the pandemic lockdowns. But by 2021, emissions were almost back to pre-pandemic levels. This shows there is still work to be done.
How are international agreements and emissions reduction targets addressing global climate change?
The third source explains the efforts to fight climate change. Countries are working together under the UNFCCC. They are setting goals to reduce emissions. By sharing and following through on these actions, they hope to make a big difference.
How do policy and technological choices impact a country’s carbon footprint?
The first source talks about how countries’ choices matter. Economic development often leads to more emissions. But choosing clean energy can help a lot. Countries using more nuclear and renewable energy tend to be greener.
Source Links
- CO₂ emissions – https://ourworldindata.org/co2-emissions
- CO2 Emissions by Country – Worldometer – https://www.worldometers.info/co2-emissions/co2-emissions-by-country/
- Analysis: Which countries are historically responsible for climate change? – Carbon Brief – https://www.carbonbrief.org/analysis-which-countries-are-historically-responsible-for-climate-change/
- CO₂ and Greenhouse Gas Emissions – https://ourworldindata.org/co2-and-greenhouse-gas-emissions
- 4 Charts Explain Greenhouse Gas Emissions by Countries and Sectors – https://www.wri.org/insights/4-charts-explain-greenhouse-gas-emissions-countries-and-sectors
- Global Carbon Atlas – https://globalcarbonatlas.org/
- Carbon Footprint by Country 2024 – https://worldpopulationreview.com/country-rankings/carbon-footprint-by-country
- List of countries by carbon dioxide emissions – https://en.wikipedia.org/wiki/List_of_countries_by_carbon_dioxide_emissions
- This Interactive Chart Shows Changes in the World’s Top 10 Emitters – https://www.wri.org/insights/interactive-chart-shows-changes-worlds-top-10-emitters
- CO2 Emissions per Capita – Worldometer – https://www.worldometers.info/co2-emissions/co2-emissions-per-capita/
- List of countries by carbon dioxide emissions per capita – https://en.wikipedia.org/wiki/List_of_countries_by_carbon_dioxide_emissions_per_capita
- 9 Charts Explain Per Capita Greenhouse Gas Emissions by Country – https://www.wri.org/insights/charts-explain-per-capita-greenhouse-gas-emissions
- CO2 Emissions in 2022 – Analysis – IEA – https://www.iea.org/reports/co2-emissions-in-2022
- Emissions from Fossil Fuels Continue to Rise – https://earthobservatory.nasa.gov/images/152519/emissions-from-fossil-fuels-continue-to-rise
- Global carbon emissions from fossil fuels reached record high in 2023 – https://sustainability.stanford.edu/news/global-carbon-emissions-fossil-fuels-reached-record-high-2023
- The Emissions Database for Global Atmospheric Research – https://edgar.jrc.ec.europa.eu/report_2022
- No title found – https://www.cia.gov/the-world-factbook/field/carbon-dioxide-emissions/country-comparison
- The 5 Countries That Produce the Most Carbon Dioxide (CO2) – https://www.investopedia.com/articles/investing/092915/5-countries-produce-most-carbon-dioxide-co2.asp
- Who has contributed most to global CO2 emissions? – https://ourworldindata.org/contributed-most-global-co2
- The History of Carbon Dioxide Emissions – https://www.wri.org/insights/history-carbon-dioxide-emissions
- Global inequalities in CO2 emissions – https://ourworldindata.org/inequality-co2
- How large are inequalities in global carbon emissions – and what to do about it? – https://hdr.undp.org/content/how-large-are-inequalities-global-carbon-emissions-and-what-do-about-it
- Global carbon inequality over 1990–2019 – Nature Sustainability – https://www.nature.com/articles/s41893-022-00955-z
- Emission Reductions From Pandemic Had Unexpected Effects on Atmosphere – https://www.jpl.nasa.gov/news/emission-reductions-from-pandemic-had-unexpected-effects-on-atmosphere
- Global patterns of daily CO2 emissions reductions in the first year of COVID-19 – Nature Geoscience – https://www.nature.com/articles/s41561-022-00965-8
- The Impact of COVID-19 Outbreak on CO2 Emissions in the Ten Countries with the Highest Carbon Dioxide Emissions – https://www.ncbi.nlm.nih.gov/pmc/articles/PMC10281825/
- Global Climate Agreements: Successes and Failures – https://www.cfr.org/backgrounder/paris-global-climate-change-agreements
- Net Zero Coalition | United Nations – https://www.un.org/en/climatechange/net-zero-coalition
- Countries leading the world’s decarbonization – ClimateTrade – https://climatetrade.com/top-10-countries-leading-the-worlds-decarbonization/
- Climate change mitigation: reducing emissions – https://www.eea.europa.eu/en/topics/in-depth/climate-change-mitigation-reducing-emissions
- The Sectoral Solution to Climate Change – https://www.unep.org/interactive/sectoral-solution-climate-change/
- How do countries measure greenhouse gas emissions? – https://www.unep.org/news-and-stories/story/how-do-countries-measure-greenhouse-gas-emissions
- Key Findings | United Nations – https://www.un.org/en/climatechange/science/key-findings
- World carbon dioxide emissions data by country: China speeds ahead of the rest – https://www.theguardian.com/news/datablog/2011/jan/31/world-carbon-dioxide-emissions-country-data-co2
- Global energy and CO2 emissions in 2020 – Global Energy Review 2020 – Analysis – IEA – https://www.iea.org/reports/global-energy-review-2020/global-energy-and-co2-emissions-in-2020