Asia is the biggest and most populous continent in the world. It’s home to some of the wealthiest nations. In 2023, Singapore leads as the richest country in Asia with a GDP (PPP) per capita of $157,3541. Qatar comes next, ranking second in Asia and fourth globally, with a GDP per capita of $142,834 in 20231. Macau, though not officially ranked, has a GDP per capita of $89,558 in 20231. At the other end, Afghanistan has the lowest GDP per capita in Asia, at just $2,042 in 20231.
The Richest Countries in Asia 2024
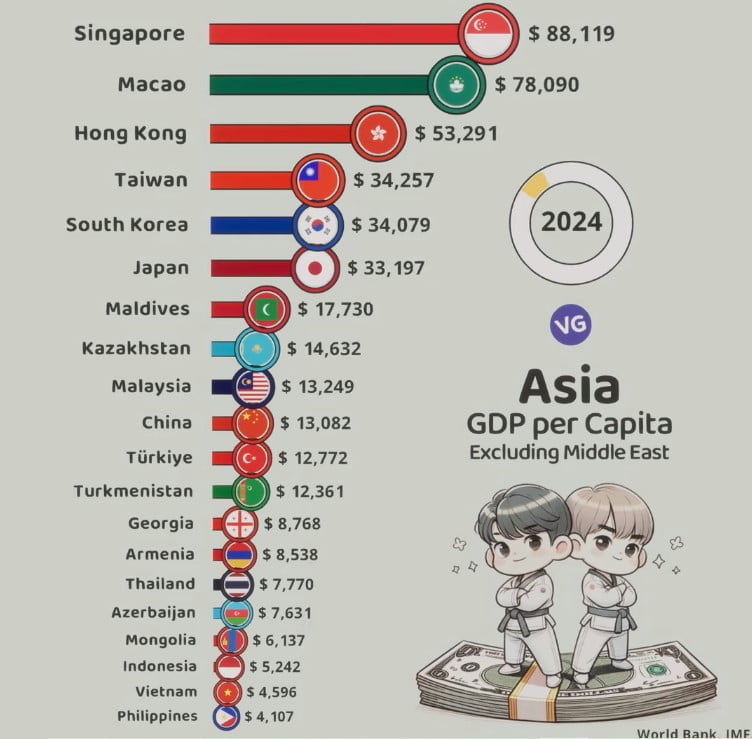
| Flag | Country | GDP per Capita (USD) |
|---|---|---|
| 🇸🇬 | Singapore | 88,119 |
| 🇲🇴 | Macao | 78,090 |
| 🇭🇰 | Hong Kong | 53,291 |
| 🇹🇼 | Taiwan | 34,257 |
| 🇰🇷 | South Korea | 34,079 |
| 🇯🇵 | Japan | 33,197 |
| 🇲🇻 | Maldives | 17,730 |
| 🇰🇿 | Kazakhstan | 14,632 |
| 🇲🇾 | Malaysia | 13,249 |
| 🇨🇳 | China | 13,082 |
| 🇹🇷 | Türkiye | 12,772 |
| 🇹🇲 | Turkmenistan | 12,361 |
| 🇬🇪 | Georgia | 8,768 |
| 🇦🇲 | Armenia | 8,538 |
| 🇹🇭 | Thailand | 7,770 |
| 🇦🇿 | Azerbaijan | 7,631 |
| 🇲🇳 | Mongolia | 6,137 |
| 🇮🇩 | Indonesia | 5,242 |
| 🇻🇳 | Vietnam | 4,596 |
| 🇵🇭 | Philippines | 4,107 |
The average GDP per capita in Asia is higher than the world’s average. This shows the region’s strong economic growth. Countries like China, Japan, South Korea, and Taiwan are among the top 20. Most Asian countries have high GDP per capita, showing a well-developed economy across the continent1.
Key Takeaways
- Singapore is the richest country in Asia based on GDP (PPP) per capita, with an estimated value of $157,354 in 2023.
- Qatar ranks second in Asia and fourth in the world, with a GDP per capita of $142,834 in 2023.
- Macau has a GDP per capita of $89,558, despite not being formally ranked.
- Afghanistan has the lowest GDP per capita in Asia at $2,042 in 2023.
- The average GDP per capita of Asian countries is notably higher than global averages, showcasing the region’s economic prosperity.
Measuring a Country’s Wealth: GDP, GDP Per Capita, and GNI
Asia GDP per Capita (2024)
Source: World Bank, IMF
When looking at a nation’s economy, we often start with its gross domestic product (GDP). This key metric shows the total value of all goods and services made in a country over a set time2. It gives us a quick look at the country’s economic health and how productive it is3.
GDP: A Snapshot of Economic Health
GDP is a broad measure that covers all economic activities in a country, from making goods and farming to services and investments2. By watching GDP over time, experts and leaders can see how the economy is doing. They can spot growth patterns and make smart choices about economic plans3.
GDP Per Capita: Welfare of the Average Citizen
GDP per capita is a way to look at the economy by dividing the total GDP by the population2. This tells us about the average person’s standard of living and economic health. It gives a fuller view of a country’s wealth4.
GNI Per Capita: Accounting for Tax Shelters
Gross national income (GNI) per capita is another way to measure a country’s wealth. It’s like GDP per capita but focuses on what citizens earn, not just what they make4. This is key when a country’s GDP might be too high because of foreign companies using it to avoid taxes. GNI per capita shows a truer picture of what people earn3.
Looking at GDP, GDP per capita, and GNI per capita together helps us understand a country’s economy better. It shows what’s strong, weak, and where there’s room to grow and improve243.
Top Asian Countries by Total GDP
Asia is home to some of the world’s largest and most dynamic economies. China stands out as the undisputed economic powerhouse5, with a GDP of $18.53 trillion. It’s the largest economy in Asia5. Japan follows, with a GDP of $4.11 trillion, ranking second in Asia5. India rounds out the top three, with a GDP of $3.93 trillion5.
Beyond the top three, Asia’s economy is diverse and dynamic. South Korea is fourth with a GDP of $1.76 trillion5. Indonesia and Turkey both have GDPs of $1.11 trillion5. Other notable economies include Taiwan ($803.0 billion), Thailand ($548.9 billion), and Israel ($530.6 billion)5. At the lower end, Afghanistan ($7.43 billion) and Bhutan ($3.31 billion) complete the list5.
China: The Economic Powerhouse
China’s success comes from its diverse industries like mining, manufacturing, construction, and agriculture5. Its large population, strategic location, and business-friendly policies have made it a global economic leader5. With a GDP of $24.27 trillion5, China plays a big part in the Asia-Pacific’s wealth, valued at $177.82 trillion in 20226.
India: Rapidly Growing Service and Agriculture Sectors
India’s economy is the third-largest in Asia, driven by services, manufacturing, and agriculture5. With a GDP of $3.93 trillion5, it’s one of the fastest-growing economies. Its population’s growth and urbanization fuel its economy5. In 2022, the average wealth per adult was $16,500, and there were 849,000 millionaires6.
Japan: Leader in Technology and Innovation
Japan has a GDP of $5.3 trillion5 and is the third-wealthiest in Asia5. It’s known for its advanced technology and innovation5. Companies like Toyota Motor Corporation and Sony Corporation make Japan a leader in tech and manufacturing6.
“Asia’s total wealth in 2022 was reported at approximately $177.82 trillion, with China alone holding nearly $84.48 trillion.”6
China, India, and Japan show Asia’s economic strength and diversity. These countries, along with others, make Asia a key player in the global economy567.
The Richest Countries in Asia by GDP Per Capita
When we look at the economy of Asia, countries like China, India, and Japan stand out. But when we focus on GDP per capita, we see a different story. This measure shows how well the average citizen is doing economically8. The top 10 richest Asian countries by GDP per capita include both small, business-friendly economies and oil-rich nations9.
- Singapore leads with the highest GDP per capita in PPP at $133,7379.
- Qatar is second with a GDP per capita of $112,2829.
- The United Arab Emirates ranks third with a GDP per capita of $96,8459.
- Brunei Darussalam holds the fourth position with a GDP per capita of $77,5349.
- Saudi Arabia is in the fifth position with a GDP per capita of $70,3329.
- Bahrain occupies the sixth position with a GDP per capita of $62,6719.
- South Korea is in the seventh spot with a GDP per capita of $59,3299.
- Cyprus follows in eighth place with a GDP per capita of $58,7329.
- Israel holds the ninth position with a GDP per capita of $55,5329.
- Japan rounds up the top ten richest countries in Asia with a GDP per capita of $54,1839.
Countries like Turkmenistan, Iran, and Georgia also make the list, with GDP per capita ranging from $19,940 to $22,3608. Thailand, China, Kazakhstan, Russia, Malaysia, Maldives, Oman, and Turkey are also considered wealthy, with GDP per capita between $22,490 and $41,8908.
This variety in rankings shows the diverse economic scenes and development levels across Asia10. The average GDP per capita in Asia for 2022 was $26,702 across 41 countries. The range was wide, from $4,002 in Nepal to $108,036 in Singapore10. This highlights the importance of looking beyond averages to understand the economic reality in the region.
As Asia continues to grow, understanding the wealth distribution and economic drivers of its prosperous countries is key. This knowledge will help shape policies and strategies for sustainable growth8910.
Singapore: Wealth Beyond Oil and Gas
Singapore is the third richest country in Asia, with a GDP per capita of over $82,000 USD11. It’s not just oil and gas that make it rich. Its low corruption and business-friendly policies draw in investors worldwide11.
Low Corruption and Business-Friendly Policies
Singapore is the most open and least corrupt market globally11. It’s a top spot for global businesses. The country offers tax breaks, efficient rules, and a skilled workforce to boost innovation and growth11.
It’s also known for its strong legal system and rule of law. This makes it a stable place for businesses to thrive, making it a top choice for investors11.
Singapore’s great location, solid infrastructure, and pro-business stance make it a key trade and commerce center. It focuses on innovation and tech, with finance, logistics, and IT being key to its success11.
Singapore’s wealth shows its commitment to a good business environment, strong governance, and investing in its people and infrastructure11. This has made it a leading financial and business hub, with a GDP per capita among the world’s highest11.

Asia’s Small but Mighty Economies
Many of Asia’s top countries by GDP per capita are small but successful. Qatar is a great example. It’s a small nation on the Arabian Peninsula with a per capita GDP of $100,04012. This is thanks to its huge oil reserves.
Qatar: Riding the Wave of Oil Riches
Qatar’s economy boomed thanks to its oil and natural gas. It’s a top exporter of liquefied natural gas (LNG). This wealth has helped Qatar become one of the wealthiest countries12.
This wealth has funded a strong infrastructure, education, and healthcare. It also keeps the living standards high for its people.
But, Qatar’s economy is at risk because it depends a lot on oil and gas exports12. To reduce this risk, Qatar is investing in finance, tourism, and technology12. These moves help Qatar grow sustainably over time.
Qatar’s success shows the power of good planning and managing resources well12. It’s a model for other oil-rich countries. Qatar proves that small economies can do well on the world stage.
“Qatar’s economy has been propelled by its abundant natural resources, primarily its massive oil and natural gas reserves.”
| Indicator | Value |
|---|---|
| Population of East Asia | 1.6 billion12 |
| GDP of East Asia (nominal) | $29 trillion12 |
| GDP of East Asia (PPP) | $44 trillion12 |
| GDP growth rate of East Asia | 3.8% (2023 est.)12 |
| GDP per capita in East Asia (nominal) | $18,12512 |
| GDP per capita in East Asia (PPP) | $27,50012 |
| Inflation rate (CPI) in East Asia | 2.2% (2023 est.)12 |
| Unemployment rate in East Asia | 4.2% (2021)12 |
| Government debt in East Asia | 105.9% of GDP (2023 est.)12 |
Qatar is working hard to not rely too much on oil and gas12. By diversifying its economy and managing its resources well, Qatar is becoming a strong player in Asia.
The Influence of Population Size and Resources
Asia’s wealth and economic strength come from its large population and natural resources13. It covers about 30% of the Earth and is home to 60% of the world’s people14. This large land and people make it a hub for big economies.
How many people live in a place affects its economy14. Asia’s average is 289 people per square mile, much higher than North America’s 5614. Places like Japan and Singapore are even more crowded. This means they have a big workforce and lots of customers for businesses.
Natural resources are key to a country’s wealth13. The Middle East is a big player in oil and gas, with Saudi Arabia leading in oil exports in 202213. Asia also exports a lot of food and wood products.
| Natural Resource | Major Asian Producers/Exporters |
|---|---|
| Rice | 13 Asia makes and eats 90% of the world’s rice. |
| Timber | 13 Indonesia and Malaysia are big on tropical timbers like teak13. China was the top wood furniture exporter in 2021. |
| Seafood | 13 China leads in seafood production, with Asia making over 90% of the world’s seafood. |
| Fossil Fuels | 13 The Middle East has a lot of oil and gas, with Saudi Arabia leading in oil exports in 202213. Russia is also a big player in Asia’s fuel sector. |
Big countries like China and India do well in total GDP15. But smaller countries can do better in GDP per person by using their resources well or having good business conditions15. Countries like Hong Kong, Korea, Singapore, and Taiwan have grown fast by using technology well.
In summary, Asia’s wealth and economic strength come from its big population and natural resources13. Its large land, people, and resources make it a key player in the world economy. Some countries do better by using resources wisely and innovating.

Wealth Distribution and Income Inequality
GDP per capita is a good way to compare countries, but it doesn’t show everything about a nation’s wealth and how people live16. In many Asian countries, income inequality is a big issue. We need more detailed metrics to understand how people are really doing economically16.
Looking Beyond National Averages
In developing Asia, the average GDP growth rate was 7.0% in 2011, much higher than in Latin America and the Caribbean at 2.8%16. The average person’s income grew a lot, from $2,423 to $10,725 between 1990 and 201716. But, these numbers hide big differences within each country.
In Thailand, the income Gini coefficient was 43.3% in 2021, showing big inequality17. The top 10% of people own more than half the wealth. The average income in Bangkok was much higher than in the poorest Northeast region17.
Other countries in developing Asia show similar inequality16. The Gini coefficient got worse in nine countries, including China, India, and Indonesia, from the early 1990s to 201316. But, developing Asia still has lower inequality than some other regions16.
Unequal access to resources, skills, and job chances adds to the problem of inequality in developing Asia16. The COVID-19 pandemic made things worse, increasing the learning gap and the number of households in debt17.
Despite reducing extreme poverty, there’s still a lot to do to make sure economic growth helps everyone equally16.
“Over the following four decades, there was a convergence in incomes, especially noticeable in South-East Asia, where incomes grew faster than in rich countries.”18
Emerging Economies and Future Growth Potential
Asia is home to both wealthy nations and emerging economies ready for big growth19. India might become the third-largest economy by 203019. It lifted over 90 million people out of extreme poverty from 2011 to 201519. South Asia is expected to grow by 5.5% in 202319.
But, challenges exist too. Sri Lanka’s economy fell apart in 2022 due to poor government management and high inflation19. The Maldives faced big challenges from rising global commodity prices in 202319. Still, many Asian countries are set for steady growth and development.
Bangladesh plans to reach upper-middle-income status by 2031, but it needs to create more jobs and diversify its exports19. Pakistan’s economy grew thanks to private and government spending, with help from China’s investments and exports19. Bhutan’s economy expanded by 4.6% in the 2022/23 fiscal year, boosted by tourism’s return19.
Challenges lie ahead, like political instability in countries like Pakistan, India, and Afghanistan, which could slow growth19. Natural disasters, like floods in Pakistan and earthquakes in Nepal, also hurt the economy19.
Despite these issues, Asia’s emerging economies still show strong growth potential20. The IMF predicts a 3.1% global growth in 2024, with Asia’s growth at 4.7% that year20. Asia is set to drive global growth in 2024, contributing two-thirds of it20.
Thailand, Brunei Darussalam, and the Lao People’s Democratic Republic are expected to see economic growth in 202420. China, the second-largest economy, will grow by 4.2% in real GDP and 4.90% in GDP per capita in 202420. Kazakhstan, Kyrgyzstan, and Malaysia are also expected to see growth rates of 4.2%, 4.3%, and 4.3% respectively20.
Asia’s emerging economies are a ray of hope in uncertain times21. The World Bank gave $10.1 billion to the region in 2023 for 37 projects, showing support for growth21. With the right investments and reforms, Asia’s emerging economies are set to lead the global economy’s future19.
The Richest Countries in Asia: A Diverse Landscape
The richest countries in Asia show a wide range of economies. They go from big, crowded nations to small, rich states. To really understand a country’s wealth, we must look at its economy, society, and politics. This gives us a full picture of each Asian economy22.
Asia’s economies are very different from each other. The region made up 57 percent of the world’s GDP growth from 2015 to 2021. In 2021, it made up 42 percent of the world’s GDP22. Asia is also a big player in trade, making up 53 percent of global goods trade in 202122.
Things like population size, natural resources, and economic policies affect a country’s wealth. Countries like China are huge economic powers. Others, like Singapore and Qatar, are small but very rich23. The currencies of these countries, like the Japanese Yen and Chinese Yuan Renminbi, are important worldwide24.
FAQ
What are the key economic indicators used to measure a country’s wealth?
To measure a country’s wealth, we look at Gross Domestic Product (GDP), GDP per capita, and Gross National Income (GNI) per capita.
How does GDP differ from GDP per capita?
GDP adds up the value of all goods and services made in a country. GDP per capita divides this by the population. This shows the average standard of living and economic well-being.
What is the difference between GDP per capita and GNI per capita?
GNI per capita looks at the income a country gets. GDP per capita looks at the products it makes. This difference helps us understand if a country’s GDP is boosted by foreign companies.
Which Asian countries have the highest total GDP?
China, India, and Japan are the top 3 Asian countries by total GDP.
Which Asian countries have the highest GDP per capita?
Countries like Singapore, Qatar, and others have the highest GDP per capita. They are smaller, more business-friendly, or rich in oil.
What factors influence a country’s economic wealth and prosperity?
A country’s size, natural resources, government policies, and business environment affect its wealth and prosperity.
How do emerging Asian economies compare to the wealthiest Asian countries?
Countries like Bangladesh, India, and the Philippines are growing fast. They’re set for more prosperity thanks to tech, good demographics, and policy changes.
Source Links
- List of Asian countries by GDP (PPP) per capita – https://en.wikipedia.org/wiki/List_of_Asian_countries_by_GDP_(PPP)_per_capita
- GDP Per Capita: Definition, Uses, and Highest Per Country – https://www.investopedia.com/terms/p/per-capita-gdp.asp
- Gross Domestic Product (GDP): 12 Things to Know – https://www.adb.org/news/features/gross-domestic-product-gdp-12-things-know
- GDP per capita – https://ourworldindata.org/grapher/gdp-per-capita-worldbank
- List of Asian countries by GDP – https://en.wikipedia.org/wiki/List_of_Asian_countries_by_GDP
- 20 Wealthiest Countries in Asia – https://finance.yahoo.com/news/20-wealthiest-countries-asia-212348696.html
- Economy of Asia – https://en.wikipedia.org/wiki/Economy_of_Asia
- 23 Richest Countries in Asia by GDP Per Capita in 2023 – https://finance.yahoo.com/news/23-richest-countries-asia-gdp-110724442.html
- The Richest Countries in Asia – https://www.worldatlas.com/gdp/the-richest-countries-in-asia.html
- GDP per capita, PPP in Asia | TheGlobalEconomy.com – https://www.theglobaleconomy.com/rankings/gdp_per_capita_ppp/Asia/
- The five richest countries in the world – https://nomadcapitalist.com/expat/top-5-richest-countries-world/
- Economy of East Asia – https://en.wikipedia.org/wiki/Economy_of_East_Asia
- Asia: Resources – https://education.nationalgeographic.org/resource/asia-resources
- Asia – https://kids.britannica.com/students/article/Asia/272975
- Economic Issues 1 — Growth in East Asia – https://www.imf.org/external/pubs/ft/issues1/
- PDF – https://www.g24.org/wp-content/uploads/2018/10/Rising_income_inequality_in_Asia.pdf
- Bridging the Gap: Inequality and Jobs in Thailand – https://www.worldbank.org/en/country/thailand/publication/bridging-the-gap-inequality-and-jobs-in-thailand
- The history of global economic inequality – https://ourworldindata.org/the-history-of-global-economic-inequality
- Emerging Economies in South Asia – https://www.investopedia.com/articles/investing/022316/south-asia-new-face-emerging-economies.asp
- 20 Fastest Growing Economies in Asia in 2024 – https://finance.yahoo.com/news/20-fastest-growing-economies-asia-180718997.html
- Overview – https://www.worldbank.org/en/region/sar/overview
- Asia on the cusp of a new era – https://www.mckinsey.com/mgi/our-research/asia-on-the-cusp-of-a-new-era
- Top 10 Largest Countries In Asia By Area In 2024 – https://bestdiplomats.org/largest-countries-in-asia-by-area/
- Asian Countries and Their Currencies – The Nomad Capitalist’s Guide – https://nomadcapitalist.com/finance/asian-countries-and-currencies/